![]()
![]()
![]()
![]()
![]()
![]()
![]()
![]()
![]()
![]()
![]()
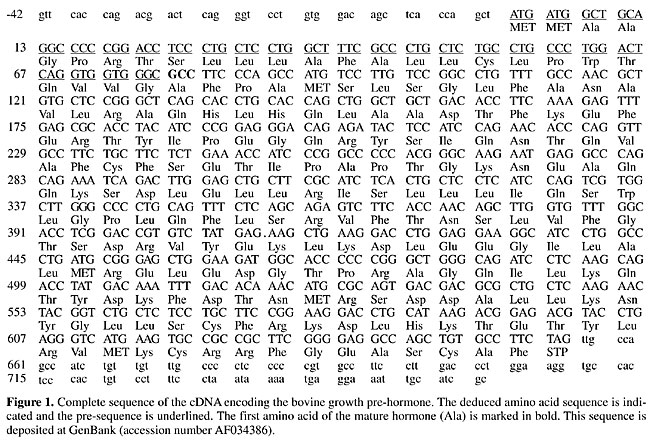
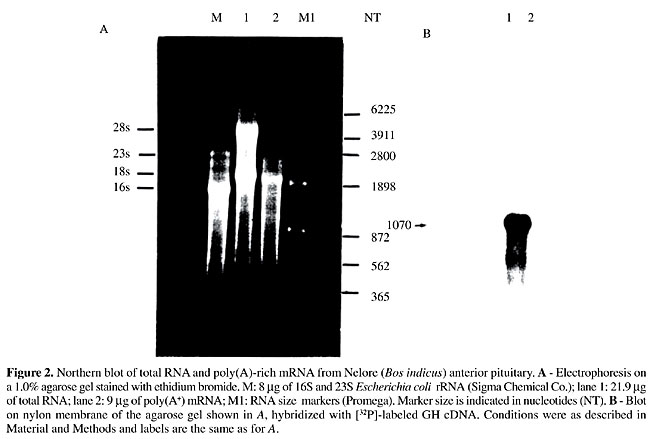
ABSTRACT. The effects of breed and of recombinant bovine somatotropin (rbST) treatment on growth hormone gene expression were studied in young bulls. The experiment was completely randomized in a [2 x 2]-factorial arrangement, using two levels of rbST (0 or 250 mg/animal/14 days), and two breed groups (Nelore and Simmental x Nelore crossbred). A cDNA encoding Bos indicus growth hormone was cloned and sequenced for use as a probe in Northern and dot blot analyses. Compared to the Bos taurus structural gene, the Bos indicus cDNA was found to begin 21 bases downstream from the transcription initiation site and had only two discrepancies (C to T at position 144-His and T to C at position 354-Phe), without changes in the polypeptide sequence. However, two amino acid substitutions were found for Bubalus spp., which belong to the same tribe. The rbST treatment did not change any of the characteristics evaluated (body and pituitary gland weights, growth hormone mRNA expression level). Crossbred animals had significantly higher body weight and heavier pituitaries than Nelore cattle. Pituitary weight was proportional to body weight in both breed groups. Growth hormone mRNA expression in the pituitary was similar (P>0.075) for both breed and hormonal treatment groups, but was 31.9% higher in the pure Nelore group, suggesting that growth hormone gene transcription regulation differs among these breeds. Key words: Recombinant bovine somatotropin, Bovine pituitary Growth hormone gene expression, Bos indicus, Bos taurus INTRODUCTION Endocrine growth control involves complex interactions of several hormones and growth factors, acting in both an endocrine and a paracrine or autocrine manner. In this context the somatotropic axis, which is composed of the pituitary growth hormone (GH or somatotropin), its receptor (GHR), insulin-like growth factors (IGF), IGF binding proteins (IGFBP) and the IGF-I receptor (IGF-IR), plays an essential role in postnatal growth regulation, especially in nutrient utilization. Although GH blood levels depend on physiological states and other regulatory factors, there is evidence of an association of genetic characteristics with GH plasma levels. Increased GH blood levels have been reported in dairy cattle selected for elevated milk yield (Peel and Bauman, 1987), lean-selected sheep (Venters et al., 1995, cited by Fleming et al., 1997) and low backfat pigs (Althen and Gerritz, 1976), compared with divergently selected lineages. GH gene polymorphism affects GH plasma levels (Schlee et al., 1994). However, elevated GH plasmatic levels are apparently not dependent on GH gene transcription activity, since Fleming et al. (1997) found higher total GH in lean than in fat lamb pituitary glands, though GH mRNA concentrations were similar. Recombinant bovine somatotropin (rbST) treatment of ruminants with an intact somatotropic axis may also alter pituitary GH production. Moseley et al. (1992) observed an anterior pituitary gland weight increase in beef steers treated with rbST, but a reduction in GH content and concentration in this gland. We evaluated GH mRNA expression in young bull pituitaries from two different breed groups treated with rbST. MATERIAL AND METHODS Animals and experimental procedures Twenty intact male calves were weaned at 7-8 months and housed in collective pens for 180 days. A completely randomized experimental design was applied in a 2 x 2-factorial arrangement, using two levels of rbST (0 or 250 mg/animal/14 days) and two breed groups (Nelore and Simmental x Nelore crossbred). Lactropin-500Ò (500 mg) was supplied in syringes in a prolonged release vehicle formulated by Monsanto Agricultural Co. (St. Louis, MO, USA). Nontreated animals were injected with saline. Diet, designed for a weight gain of 1.0 kg/animal/day, was based on corn silage and concentrate (cracked corn, whole soybeans, urea and mineral premix). At 13-14 months, 10 young bulls of each breed group (five treated and five nontreated) were slaughtered and their pituitary glands were collected, weighed and immediately frozen in liquid nitrogen. Cloning and sequencing of GH cDNA Total RNA was isolated from Nelore (Bos indicus) anterior pituitary glands by the acidified phenol-guanidinium thiocyanate method (Chomczynski and Sacchi, 1987). Polyadenylated RNA (poli A+) was isolated from 1.83 mg of this RNA by oligo-dT-cellulose chromatography, as described by Sambrook et al. (1989). The polyadenylated RNA was transcribed into single-strand complementary DNA using reverse transcriptase and the second DNA strand synthesis was done using DNA polymerase I, as described in the ZAP-cDNA Synthesis kit (Stratagene). After packaging, lambda recombinants were transfected into an Escherichia coli cell line (XL1-blue MRF’) and the amplified library was screened using a partial GH bovine cDNA (kindly provided by Dr. W. Rodrigues, University of São Paulo, Ribeirão Preto Campus) labeled by the random-priming method using [a-32P]-dATP and [a-32P]-dCTP. Of 8,500 clones, 420 were hybridized in the first screening, and 20 of which were chosen from the second screening for digestion with XhoI and EcoRI. After separation on 1.0% agarose gel, fragment sizes were determined by Southern blot (Sambrook et al., 1989), with 14 clones showing insertion in the 500- to 800-pb range. A cDNA clone, GH35, containing the largest insert, was fully sequenced as double-stranded DNA by the dideoxy-mediated chain termination method (Sanger et al., 1977) using a cycle sequencing kit (Pharmacia) and [a-32P]-dATP. Initially, pB SK (+) T3 and T7 primers (Stratagene) were used to sequence the 5’ and 3’ ends, followed by complete sequencing of both strands by primer walking. The Bos indicus GH cDNA was used as a probe in GH mRNA measurements and for comparison with Bos taurus and Bubalus bubalis sequences. Northern blotting Total anterior pituitary RNA and poli A+ mRNA were denatured by formamide and formaldehyde and separated according to size on a 1.5% denaturing agarose gel (Sambrook et al., 1989). After electrophoresis, RNA was transferred by capillarity to a nylon membrane (Zeta-Probe, BioRad) and then probed with GH cDNA (clone GH35) labeled with [a-32P]-dCTP under standard conditions (Sambrook et al., 1989). Cloning of a genomic sequence of rat 28S rRNA Genomic DNA from rat liver isolated according to Sambrook et al. (1989) was used as a template in a PCR with a forward (28Sup; 5’-GTGAGGCGGGGGGGCGA-3’) and a reverse primer (28Sdown; 5’-TGACGGGCGAGAGGGCG-3’) to amplify a 779-bp fragment corresponding to bases 3803 to 4581 from rat 28S rRNA gene sequence (Chan et al., 1983), which encompasses a 585-SacI/AvaI restriction fragment. PCR was carried out in a 25-ml volume in an MJ Research Thermal Cycler using a single-initial denaturation cycle at 95ºC for 3 min, annealing at 58ºC for 1 min and extension at 72ºC for 1 min; then, 35 cycles of denaturation at 94ºC for 30 s, annealing at 58ºC for 30 s and extension at 72ºC for 45 s, and lastly, extension at 72ºC for 5 min. Reaction mixture concentrations were: 1X Taq Buffer (Pharmacia), 2.5 mM dNTPs, 0.4 mM of each primer, 0.5% formamide, 0.5 U Taq DNA polymerase (Pharmacia), and 100 ng genomic DNA. The fragment was visualized on a 1.0% agarose gel stained with ethidium bromide and purified from the gel (Sambrook et al., 1989). After digestion with SacI and AvaI, the 585-bp fragment was isolated from a 1.0% agarose gel and cloned into a pUC18 plasmid previously digested with the same enzymes. Following transformation in E. coli strain DH5a, plasmid DNA from a large-scale preparation was purified by cesium chloride gradient (Sambrook et al., 1989) and double-digested with SacI and AvaI restriction enzymes. The 585-bp fragment was isolated from agarose gel and used as a probe in the dot-blot hybridization. RNA quantification by dot blotting Total RNA was extracted from whole pituitary using the acidified phenol-guanidinium thiocyanate method (Chomczynski and Sacchi, 1987) and the concentration determined by measuring absorbance at 260 nm (Sambrook et al., 1989). The integrity and DNA contamination of RNA extracted from each pituitary was evaluated by running an agarose gel electrophoresis under denaturating conditions and protein contamination was examined by the A260/A280 nm ratio (Sambrook et al., 1989). If the A260/A280 nm ratio was lower than 1.8, a new phenol-chloroform extraction was done. Growth hormone mRNA was quantified by the dot-blot hybridization method using a Bio-DotÒ microfiltration apparatus (Bio-Rad) according to manufacturer instructions. Total RNA (1.25 and 0.625 ng) was blotted onto Hybond-Nâ nylon membrane (Amersham) and fixed by UV crosslinking (160,000 mJ/cm2) using a CL-1000 ultraviolet crosslinker (UVP). Blots were hybridized with bovine GH cDNA labeled to high specific activity with [a-32P]-dATP and [a-32P]-dCTP by the random-priming method (Feinberg and Vogelstein, 1983) in a hybridization oven (Hybaid) and exposed to Kodak T-MAT X-ray film at -80ºC after washing in standard conditions. After exposure, the membrane was washed for 20 min in boiling water to remove GH cDNA probe and re-exposed to X-ray film to assure total removal of the hybridization signal. The membrane was then reprobed with a genomic sequence of 28S rRNA (28S rDNA) in order to correct for possible differences in quantifying and pipetting RNA samples. Signals were measured with a densitometer (CS-9301, Shimadzu) at 550 nm and in the zigzag-scanning mode. The area of the peaks was converted to ng of GH mRNA by using a standard curve constructed with different concentrations of GH cDNA blotted on the same membrane. RESULTS Growth hormone cDNA The complete DNA sequence and the encoded protein of the GH35 clone, the longest clone isolated from the cDNA library, was determined (Figure 1). The cloned cDNA contained 821 bp including 42 bp in the 5’-untranslated region and 576 bp coding the entire pre-hormone, the total 3’-untranslated region (101 bp) and a poly(A) tail with 24 bp. This sequence corresponds to complete exons 2, 3, 4 and 5 of the Bos taurus GH gene (Gordon et al., 1983) with the 5’-untranslated region starting at base 21 of the first exon. In the Northern analysis (Figure 2), a single-GH mRNA transcript of approximately 1,000 bp was detected, similar to findings obtained by Hampson and Rottman (1987). This value exceeds the 821 bp of the isolated clone, indicating that the latter is not a full-length cDNA, though it contains most sequences present in the mRNA. Comparing the cDNA with the gene sequence yielded only two discrepancies, both in the coding region, without changing encoded amino acids (C to T at position 144-His and T to C at position 354-Phe). There was no difference in the amino acid sequence compared to the two published sequences of Bos taurus GH mRNA (Miller et al., 1980; Seeburg et al., 1983), while three discrepancies in the nucleotide sequence were found. On the other hand, there were nine differences at the nucleotide level in the cDNA-coding region in comparison to the Bubalus arnee bubalus sequence (GenBank accession number AJ011533), with two amino acid changes (G9S and R17W), while comparison with the Bubalus arnee sequence (GenBank accession number X72947) gave 15 nucleotide level differences with two amino acid changes (A12T and G130V).
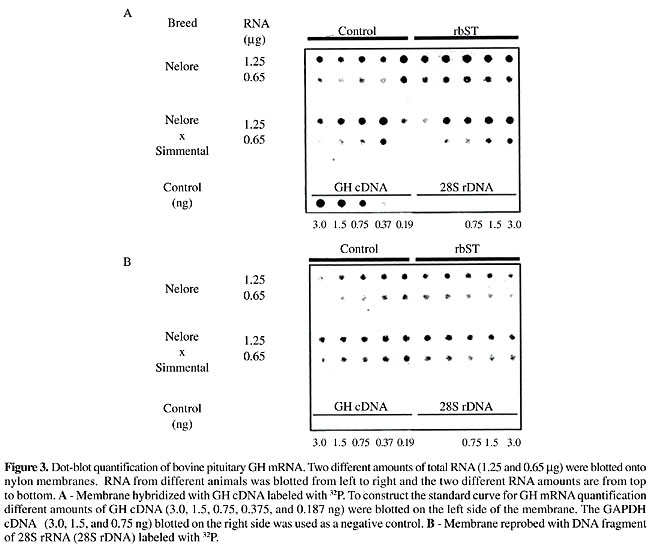
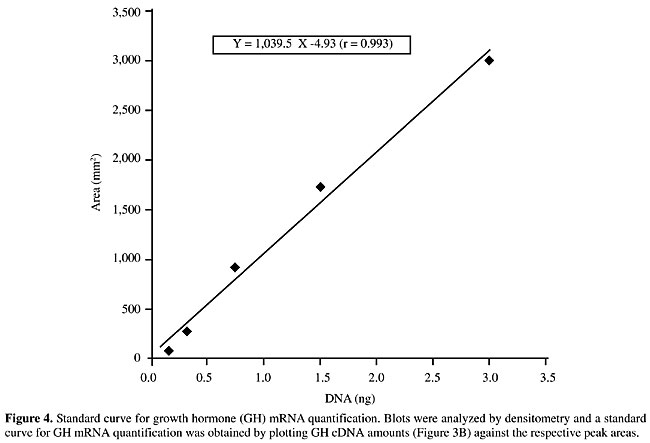
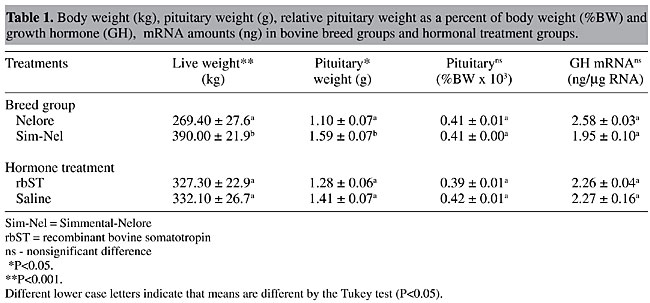
Growth hormone mRNA quantitative analysis Dot-blot hybridization was used to analyze the GH expression in young bull pituitary glands from two different breed groups treated and nontreated with rbST. To determine the ability of the dot-blot assay to accurately measure GH mRNA levels, different amounts of GH cDNA and total RNA from pituitaries were blotted onto nylon membranes and probed with GH cDNA (Figure 3, panel A). When reprobed with the 28S rDNA, the sample signals in the membrane were very similar (Figure 3, panel B). The linear ranges of detection were from 0.187 to 3.0 ng (Figure 4), with the signals from 0.65 mg of total RNA being within the standard curve for all the animals. Growth hormone mRNA levels were similar (P>0.075) in both breed groups, although GH mRNA levels in Nelore pituitaries were 32.3% higher than those of the Simmental x Nelore breed group (Table 1). Somatotropin administration did not affect the GH mRNA levels (Table 1).
Simmental x Nelore breed group animals had significantly higher body weights (P<0.01) and heavier pituitary glands (P<0.05) than Nelore cattle (Table 1). However, relative pituitary weight (as a percent of body weight) was similar in the two breed groups (Table 1). Somatotropin administration did not affect body weight, pituitary weight or relative pituitary weight (Table 1). DISCUSSION At the same age and under identical management conditions, Simmental x Nelore crossbreeds had significantly (P<0.05) higher body weight and heavier pituitaries than Nelore cattle, but pituitary weight was proportional to body weight in both breed groups (Table 1). In spite of a discrepancy in growth rate between the two breed groups, it appears that pituitary growth occurs allometrically. However, pituitary weight differences may result from genetic selection. Fleming et al. (1997) reported heavier pituitaries in a lean-selected sheep line with a high body weight than in a fat-selected line, though pituitary size differences were body-weight independent. Higher pituitary weights have also been reported in swine lineages selected for low backfat (Althen et al., 1976). Besides higher pituitary weights, the authors of both of these papers reported higher plasmatic GH levels in both lean-selected sheep and low-backfat selected swine. Pituitary weight differences result from an increase in cell number rather than in cell size (Venters et al., 1995, cited by Fleming et al., 1997), suggesting an increase in somatotroph number, causing higher GH production. In our study, rbST treatment had no significant effect on GH mRNA transcription or on pituitary weights. Moseley et al. (1992) reported a pituitary weight increase associated with GH content reduction when finishing steers received daily rbST supplements. Although rbST in a prolonged release vehicle can mimic daily hormonal injections and can sustain an elevated basal plasma GH concentration for nearly eight days after its application (Slaba et al., 1994), recombinant hormone dose and intervalic administration did not affect pituitary GH expression in our experiment. Pituitary GH production and GH plasmatic levels were not evaluated in the present study, but plasmatic IGF-I dosed before rbST administration was significantly (P<0.05) higher in the crossbred cattle (data not shown), possibly due to the higher plasmatic GH levels in this group, as reported by Breier and Sauerwein (1995). Since the Nelore animals had a lower growth rate and lower plasmatic IGF-I levels, the tendency towards higher GH mRNA concentrations was unexpected, but it could involve polymorphisms in the GH gene sequence. Relationships between gene variants and plasmatic GH and IGF-I levels have been reported by Schlee et al. (1994), who observed that Holstein cows homozygous for the leucine variant of the GH protein have higher GH plasma levels than their heterozygous counterparts. On the other hand, the heterozygous genotype in males was associated with higher IGF-I plasmatic levels and a higher genetic value for daily weight gain than was the homozygous genotype. However, animals heterozygous for this variant have not been identified in Nelore populations (Rosa, 1997; Tambasco, 1998; Mendes, 2000), suggesting that the leucine allele is predominant over the valine allele in this breed. Sequence variations of the region involved in bovine GH gene regulation have also been reported, with Hecht and Geldermann (1996) identifying six variable nucleotide sites in the 5’-flanking region, some of them potentially binding sites for trans-acting factors possibly involved in genetic expression. Rodrigues et al. (1998) identified an AAG deletion nine nucleotides upstream from TATA box in beef but not in dairy cattle. This allele’s frequency was 0.15 in 120 Nelore animals. In our study, Bos indicus cDNA showed only two discrepancies when aligned with the complete bovine GH gene sequence. However, no change was found in the polypeptide amino acid sequence, regardless of genetic differences found between Bos taurus and Bos indicus in protein (Manwell and Baker, 1980) and chromosome Y (Kieffer and Cartwright, 1968) polymorphisms. However, two amino acid substitutions were found for Bubalus spp., which belong to the same tribe. In conclusion, pituitary weight was proportional to body weight in both breed groups and the amount of GH mRNA was slightly but not significantly higher in Bos indicus than in Bos taurus crosses. The rbST treatment had no effect on GH gene expression in the pituitary gland, even though it was applied in a sustained release vehicle. ACKNOWLEDGMENTS We gratefully acknowledge CNPq and CAPES/PICD for the fellowships awarded to S.M.Z. Di Mauro and L.R. Furlan, respectively, and FINEP for financial support. REFERENCES Althen, T.G. and Gerrits, R.J. (1976). Pituitary and serum growth hormone levels in Duroc and Yorkshire swine genetically selected for high and low backfat. J. Anim. Sci. 42: 1490-1497. Breier, B.H. and Sauerwein, H. (1995). Regulation of growth in ruminants by the somatotropic axis. In: Ruminant Physiology: Digestion, Metabolism, Growth and Reproduction (von Engelhardt, W., Leonhard-Marek, S., Breves, G. and Giesecke, D., eds.). F. Enke Verlag, Stuttgard, Germany, 451-474. Chan, Y., Olvera, J. and Wool, I.G. (1983). The structure of rat 28S ribosomal ribonucleic acid inferred from the sequence of nucleotides in a gene. Nucleic Acids Res. 11: 7819-7831. Chomczynski, P. and Sacchi, N. (1987). Single-step method of RNA isolation by acid guanidinium thiocyanate-phenol-chloroform extraction. Anal. Biochem.162: 156-159. Feinberg, A.P. and Vogelstein, B.A. (1983). A technique for radiolabeling DNA restriction endonuclease fragments to high specific activity. Anal. Biochem. 132: 6-13. Fleming, J.S., Suttie, J.M., Montgomery, G.W., Gunn, J., Stuart, S.K., Littlejohn, R.P. and Gootwine, E. (1997). The effects of duplication in the ovine growth hormone (GH) gene on GH expression in the pituitaries of ram lambs from lean and fat-selected sheep lines. Domest. Anim. Endocrinol. 14: 17-24. Gordon, D.F., Quick, D.P., Erwin, C.R., Donelson, J.E. and Maurer, R.A. (1983). Nucleotide sequence of the bovine growth hormone chromosomal gene. Mol. Cell. Endocrinol. 33: 81-95. Hampson, R.K. and Rottman, F.M. (1987). Alternative processing of bovine growth hormone mRNA: Nonsplicing of the final intron predicts a high molecular weight variant of bovine growth hormone. Proc. Natl. Acad. Sci. USA 84: 2673-2677. Hecht, C. and Geldermann, H. (1996). Variants within the 5’-flanking region and the intron I of the bovine growth hormone gene. Anim. Genet. 27: 329-332. Kieffer, N.M. and Cartwright, T.C. (1968). Sex chromosome polymorphism in domestic cattle. J. Hered. 59: 35-37. Manwell, C.E. and Baker, C.M.A. (1980). Chemical classification of cattle 2. Phylogenetic tree and specific status of zebu. Anim. Blood Groups Biochem. Genet. 11:151-162. Mendes, A. (2000). Níveis plasmáticos de IGF-1 e polimorfismo no gene do GH como possíveis indicadores do potencial produtivo em bovinos. Master’s thesis, Faculdade de Medicina Veterinária e Zootecnia, Universidade Estadual Paulista, Botucatu, SP, Brazil. Miller, W.L., Martial, J.A. and Baxter, J.D. (1980). Molecular cloning of DNA complementary to bovine growth hormone mRNA. J. Biol. Chem. 255: 7521-7524. Moseley, W.M., Paulissen, J.B., Goodwin, M.C., Alaniz, G.R. and Claflin, W.H. (1992). Recombinant bovine somatotropin improves growth performance in finishing beef steers. J. Anim. Sci. 70: 412-425. Peel, C.J. and Bauman, D.E. (1987). Somatotropin and lactation. J. Dairy Sci. 70: 474-479. Rodrigues, C.V., Guimarães, S.E.F., Neto, E.D. and Pinheiro, L.E.L. (1998). Identification of a novel polymorphism in the promoter region of the bovine growth hormone gene. Anim. Genet. 29: 65-66. Rosa, A.J.M. (1997). Caracterização da raça Nelore e teste de paternidade por marcadores moleculares. Master’s thesis, Escola Superior de Agricultura “Luiz de Queiros”, Universidade de São Paulo, Piracicaba, SP, Brazil. Sambrook, J., Fritsch, E.F. and Maniatis, T. (1989). Molecular Cloning: A Laboratory Manual. 2nd edn. Cold Spring Harbor Laboratory Press, Cold Spring Harbor, NY, USA. Sanger, F., Nicklen, S. and Coulson, A.R. (1977). DNA sequencing with chain-terminating inhibitors. Proc. Natl. Acad. Sci. USA 74: 5463-5467. Schlee, P., Grami, R., Schallenberger, E., Schams, D., Rottmann, R., Olbrich-Bludau, A. and Pirchner, F. (1994). Growth hormone and insulin-like growth factor I concentrations in bulls of various growth hormone genotypes. Theor. Appl. Genet. 88: 497-500. Seeburg, P.H., Sias, S., Adelman, J.P., de Boer, H.A., Hayflick, J., Jhurani, P., Goeddel, D.V. and Heyneker, H.L. (1983). Efficient bacterial expression of bovine and porcine growth hormone. DNA 2: 37-45. Slaba, J., Krejci, P., Skarda, J., Huybrechts, L.M., Decuypere, E. and Herrmann, H. (1994). Plasma profiles of somatotropin and IGF-I in dairy cows following application of two preparations of recombinant bovine somatotropin in a sustained release vehicle. Physiol. Res. 43: 37-43. Tambasco, M.D. (1988). Detecção de polimorfismo de genes Kappa caseína e beta-lactoglobulina em animais da raça Jersey. Undergraduate monograph, Universidade Federal de São Carlos, São Carlos, SP, Brazil. |
|