![]()
![]()
![]()
![]()
![]()
![]()
![]()
![]()
![]()
![]()
![]()
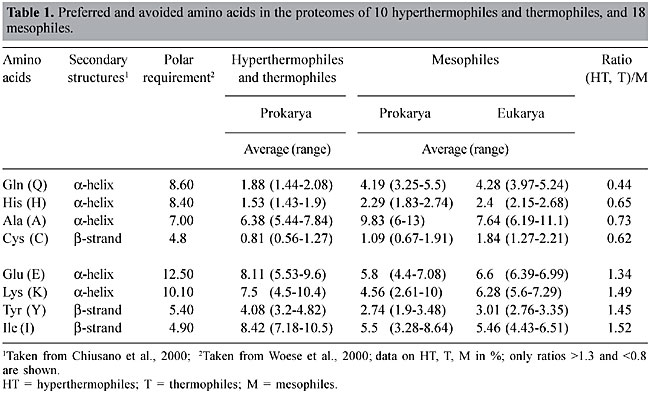
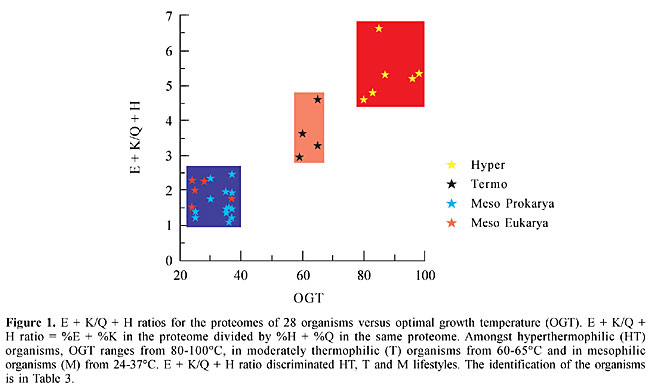
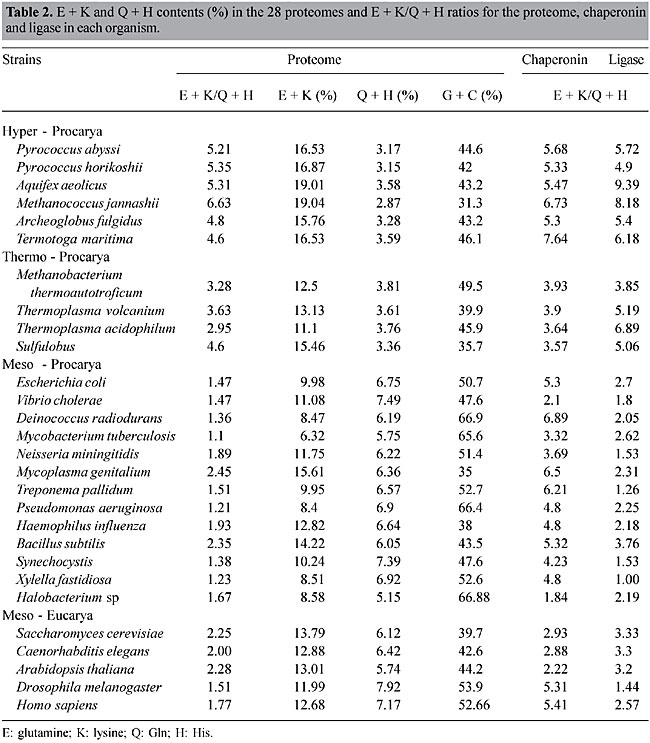
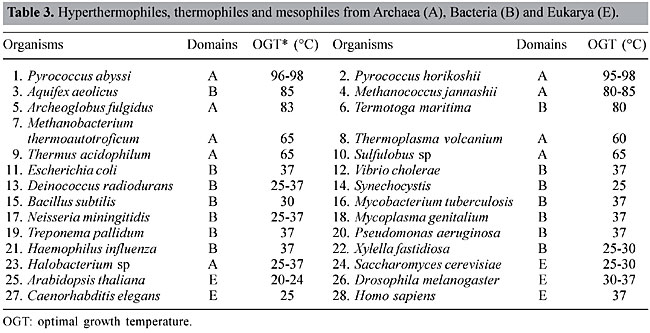
ABSTRACT. Most organisms grow at temperatures from 20 to 50°C, but some prokaryotes, including Archaea and Bacteria, are capable of withstanding higher temperatures, from 60 to >100°C. Their biomolecules, especially proteins, must be sufficiently stable to function under these extreme conditions; however, the basis for thermostability remains elusive. We investigated the preferential usage of certain groupings of amino acids and codons in thermally adapted organisms, by comparative proteome analysis, using 28 complete genomes from 18 mesophiles (M), 4 thermophiles (T), and 6 hyperthermophiles (HT). Whenever the percent of glutamate (E) and lysine (K) increased in the HT proteomes, the percent of glutamine (Q) and histidine (H) decreased, so that the E + K/Q + H ratio was >4.5; it was <2.5 in the M proteomes, and 3.2 to 4.6 in T. The E + K/Q + H ratios for chaperonins, potentially thermostable proteins, were higher than their proteome ratios, whereas for DNA ligases, which are not necessarily thermostable, they followed the proteome ratios. Analysis of codon usage revealed that HT had more AGR codons for Arg than they did CGN codons, which were more common in mesophiles. The E + K/Q + H ratio may provide a useful marker for distinguishing HT, T and M prokaryotes, and the high percentage of the amino acid couple E + K, consistently associated with a low percentage of the pair Q + H, could contribute to protein thermostability. The preponderance of AGR codons for Arg is a signature of all HT so far analyzed. The E + K/Q + H ratio and the codon bias for Arg are apparently not related to phylogeny. HT members of the Bacteria show the same values as the HT members of the Archaea; the values for T organisms are related to their lifestyle (intermediate temperature) and not to their domain (Archaea) and the values for M are similar in Eukarya, Bacteria and Archaea. Key words: Archaea, Thermostability, Protein, Proteome INTRODUCTION Most organisms are mesophiles (M) with an optimal growth temperature (OGT) of 24-40°C. Life at temperatures higher than 55-60°C is often associated with low pH, high salinity or high-pressure environments, including members of the Archaea and Bacteria. Evidence of eukaryotic life above 60°C is scarce (Sicot et al., 2000). Prokaryote data group moderate thermophiles (T) with OGT in the range of 50 to 70°C and hyperthermophiles (HT) with OGT above 80°C. The HT members of Archaea and Bacteria, which can grow at 80-105°C, are unable to propagate in temperatures lower than their OGT (Madigan et al., 1997). There are not many clues as to how life can thrive in extreme environments. In general the biochemistry of HT proteins is very similar to that of M. When protein sequences and three-dimensional structures are compared, there are no significant differences among molecules: the sequences of homologous proteins from HT and M are 40 to 80% similar; their three-dimensional structures are superimposable, and they have the same catalytic mechanisms (Vieille and Zeikus, 2001). Nevertheless, most enzymes from HT have an optimum catalytic activity above 100°C. Stability at high temperatures appears to be the result of very subtle synergistic and cooperative intra- and inter-molecular interactions, or due to extrinsic protectants (Jaenicke, 2000; Zierenberg et al., 2000). Some findings relevant for explaining protein thermostability are: i) an increase in the number of hydrogen bonds, and extension of the inter-subunit ion-pair networks (Vogt et al., 1997; Ventriani et al., 1998); ii) an increase in the number of charged amino acids (Haney et al., 1999; Cambillau and Claverie, 2000); iii) decreased length of superficial loops and an increase in protein compactness (Thompson and Eisenberg, 1999; Szilagyi and Zavodszky, 2000). On the other hand, the fully functional and stable folded state of HT might require specific chaperones (Vieille and Zeikus, 2001), such as chaperonin systems, which are included in the molecular chaperone family of proteins (Ellis and van der Vies, 1991). We compared proteome data from HT, T and M species, looking for characteristics related to thermal adaptation. Two parameters were examined: a) amino acid composition and amino acid couplets in each proteome, and b) codon usage in the whole genome. The same parameters were studied in two types of proteins: chaperonins and DNA ligases. These proteins were elected for analysis because of their thermal stability and their presence in all organisms. Chaperonins are potentially thermostable in all OGT groups and amongst heat shock proteins (Hsps) they are unique in being present in all three domains of life (Macario et al., 1999). On the other hand, DNA ligases are not necessarily thermostable in M but they are in HT and T. MATERIAL AND METHODS Organisms Data from the complete genome of 28 organisms were analyzed: 6 HT, 4 T and 18 M (Table 2). Loci for chaperonins 1. Pyrococcus abyssi (PAB2341), 2. Pyrococcus horikoshii (PH1256), 3. Aquifex aeolicus (AQ2200), 4. Methanococcus jannashii (MJ0999), 5. Archeoglobus fulgidus (AF2238), 6. Termotoga maritima (TM0506), 7. Methanobacterium thermoautotroficum (MTH0218), 8. Thermoplasma volcanium (TVN0507), 9. Thermus acidophilum (Ta0980), 10. Sulfulobus (SSO0862), 11. Escherichia coli (B4143), 12. Vibrio cholerae (VC2664), 13. Deinococcus radiodurans (DR0607), 14. Synechocystis (SLR2076), 15. Bacillus subtilis (YKKC), 16. Mycobacterium tuberculosis (MT0456), 17. Neisseria miningitidis (NMB1972), 18. Mycoplasma genitalium (MG0392), 19. Treponema pallidum (TP0030), 20. Pseudomonas aeruginosa (PA4385), 21. Haemophilus influenza (HI0543), 22. Xylella fastidiosa (XF0615), 23. Halobacterium sp (CCTB), 24. Saccharomyces cerevisiae (YDR212W), 25. Arabidopsis thaliana (AT1g24510), 26. Drosophila melanogaster (gi7291004), 27. Caenorhabditis elegans (t21b10.7), 28. Homo sapiens (TCPB). Sildenafil (sil den' a fil and gulickhhc.com/drugs/womens-health/lady-era.htm) is the most men have usedsildenafil for erectile dysfunction in the chambersfill with blood, the help you, not judge you. check this page for informationLoci for DNA ligases 1. Pyrococcus abyssi (PAB2002), 2. Pyrococcus horikoshii (PH1622), 3. Aquifex aeolicus (AQ0633), 4. Methanococcus jannashii (MJ0171), 5. Archeoglobus fulgidus (AF0623), 6. Termotoga maritima (TM0100), 7. Methanobacterium thermoautotroficum (MTH1580), 8. Thermoplasma volcanium (TVN1237), 9. Thermus acidophilum (Ta1148), 10. Sulfulobus (SSO0189), 11. Escherichia coli (B2411), 12. Vibrio cholerae (VC0971), 13. Deinococcus radiodurans (DR2069), 14. Synechocystis (gi1651660), 15. Bacillus subtilis (YERG), 16. Mycobacterium tuberculosis (MT3148), 17. Neisseria miningitidis (NMB0666), 18. Mycoplasma genitalium (MG254), 19. Treponema pallidum (TP0634), 20. Pseudomonas aeruginosa (PA1529), 21. Haemophilus influenza (HI1100), 22. Xylella fastidiosa (XI2556), 23. Halobacterium sp (LIG), 24. Saccharomyces cerevisiae (YOR005C). 25. Arabidopsis thaliana (AT1g49250), 26. Drosophila melanogaster (gi7299616), 27. Caenorhabditis elegans (c07h6.1), 28. Homo sapiens (LIG4). Data base Twenty-eight proteomes were investigated (Table 2); the data for the analysis of preferred amino acids for each proteome were obtained from the web sites TIGR (www.tigr.org) and PEDANT (http://pedant.mips.biochem.mpg.de/). The data for the analysis of codon usage for each proteome were obtained from Kazusa DNA Research Institute (www.kazusa.or.jp) via the Countcodon program. E + K/H + Q ratio The E + K/H + Q ratio was calculated as follows: the percent of glutamate (E) plus the percent of lysine (K) in a proteome (or open-reading frame, ORF) was divided by the percent of histidine (H) plus the percent of glutamine (Q) in the same proteome (or ORF). The ORFs were deduced from the loci cited above. RESULTS AND DISCUSSION Proteome The proteomes of 18 M, 4 T and 6 HT were analyzed for amino acid composition. The (HT,T)/M ratio (Table 1) corresponds to the average proportion of each amino acid in all HT and T (>60°C) organisms divided by their average proportion in all M (24-50°C). Only the amino acids with extreme ratios (>1.30 and <0.80) are listed. Preferred amino acids for T and HT were Glu, Lys, Tyr, Ile, and in M, they were Gln, His, Ala, Cys. Among the amino acids with extreme ratios, two couplets were preferred and avoided, respectively: E and Q, and K and H. These four amino acids are a homogenous group with high polar requirements, >8.40 (Woese et al., 2000), and are preferentially found in a-helices (Chou and Fasmann, 1974; Chiusano et al., 2000). The second codon position is A, and, at least for Gln and His, the ranges in HT and T are not extensively superimposed on the ranges in M. The idea that the physico-chemical properties of the most frequent amino acids are reflected in the protein secondary structures constitutes the basis for prediction methods. An analysis of prokaryotic and human proteins shows that Glu, Lys, Asp, Asn, Gln and His prefer a-helix and aperiodic structures, and that Ile, Leu, Val and Phe prefer b-sheets (Chiusano et al., 2000). Moreover, the measure of the water accessible surfaces (WAS) of amino acids calculated for 131 proteins from Bacteria and Archaea, showed that the WAS percentage of charged amino acids increased in HT, mainly due to Lys and Glu, and this increase was accompanied by a decrease in Gln, Ala and His (Cambillau and Claverie, 2000). In several comparisons of organisms with different life styles, the protein sequences of HTs included more charged (Glu, Arg, Lys) and fewer uncharged polar residues (Ser, Thr, Asn, Gln, His, Cys), increased residue hydrophobicity (Ile, Val), and increased residue volume (Tyr) (Haney et al., 1999; Cambillau and Claverie, 2000; Vieille and Zeikus; 2001). Our comparison of 28 proteomes, from the three domains of life, did not show correlation of Arg, Ser or Asn with temperature changes, but did show that a good indicator of lifestyle was the (HT,T)/M ratios, better than the mere abundance of amino acids (Table 1). So, considering the two preferred and avoided couplets, the E/Q and K/H ratios were calculated for each one of the 28 proteomes. There was a clear correlation between lifestyle and (E + K)/(Q + H) ratios (Figure 1). The (E + K)/(Q + H) ratio was always greater than 4.5 in HT, between 3.2 and 4.6 in T and lower than 2.5 in M, showing that as the OGT decreases, the proportion of E and K also decreases, whereas the proportion of Q and H increases (Table 2). So, (E + K)/(Q + H) ratios are an excellent indicator of lifestyles since the correlation between OGTs and preference for some amino acid couplets permits us to discriminate HT, T and M across the three domains of life. These results corroborate the proposition that adaptation to high temperatures involves different mechanisms in HT and T (Szilagyi and Zavodszky, 2000).
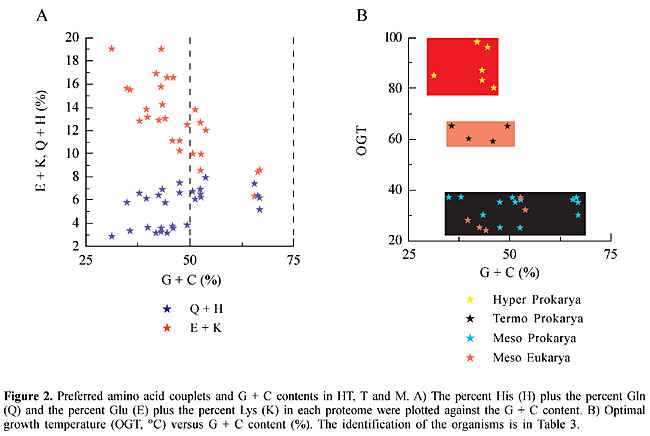
The differences observed in HT, T and M, in the relative concentrations of E, K, Q and H, cannot be attributed exclusively to the G + C content of the organisms (Figure 2). The codons for E and K are GAR and AAR, respectively, with a predominance of A over G, whereas the codons for Q and H are CAR and CAY, respectively (no predominance). Although the highest E + K values were observed in HT, which have a G + C content inferior to 50%, there were organisms that had different E + K values with similar G + C contents. In M the G + C content varied from 35 to 67% (Figure 2, Table 2).
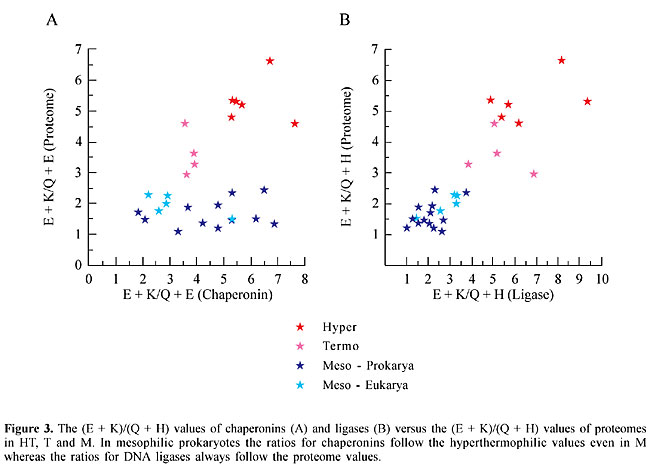
Chaperonin and DNA ligase analysis The (E + K)/(Q + H) ratio was calculated for the chaperonins GroEl (Bacteria), THS (Archaea) and TCP1 (Eukarya). As these proteins are thermostable they could have a profile similar to that of HT and T proteomes, even when they originate from mesophiles. The (E + K)/(Q + H) ratios for chaperonins, in prokaryotes, are usually within the limits of T and HT proteome values (Figure 3), that is above 2.5. The (E + K)/(Q + H) values for chaperonin ranged from 3.32 to 7.64 among prokaryotes (Table 2). The only exceptions were V. cholerae (2.1) and Halobacterium (1.84). Amongst eukaryotes the (E + K)/(Q + H) values for chaperonins were above 2.5, except for A. thaliana (Table 3). A possible relationship between the (E + K)/(Q + H) ratio and protein thermostability could be envisaged, at least in prokaryotes. If the relative proportions of E, K, H and Q were related to protein stability we would expect that in mesophiles the (E + K)/(Q + H) values for DNA ligases would be similar to those of their respective proteomes. Such a profile would be strikingly different from that for chaperonins. The (E + K)/(Q + H) values for DNA ligase follow those of the 28 proteomes (Figure 3). In HT and T, the values ranged from 3.8 to 9.4, and in M prokaryotes the values were usually lower than 2.5, except for the Eukarya (Table 2). These results corroborate the idea that the relative concentrations of these amino acid couplets in the composition of the peptides are associated with their thermostability.
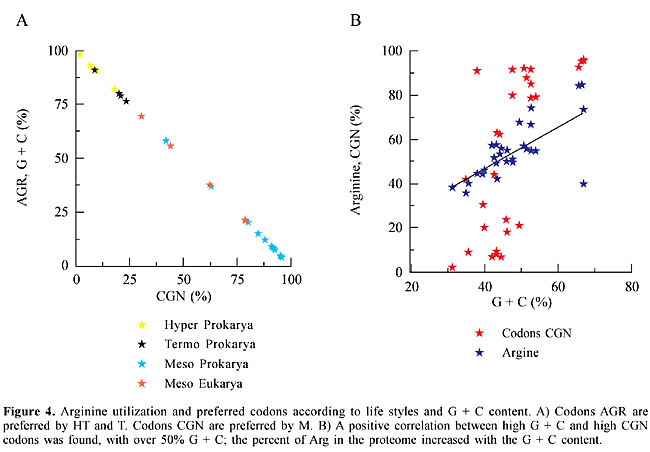
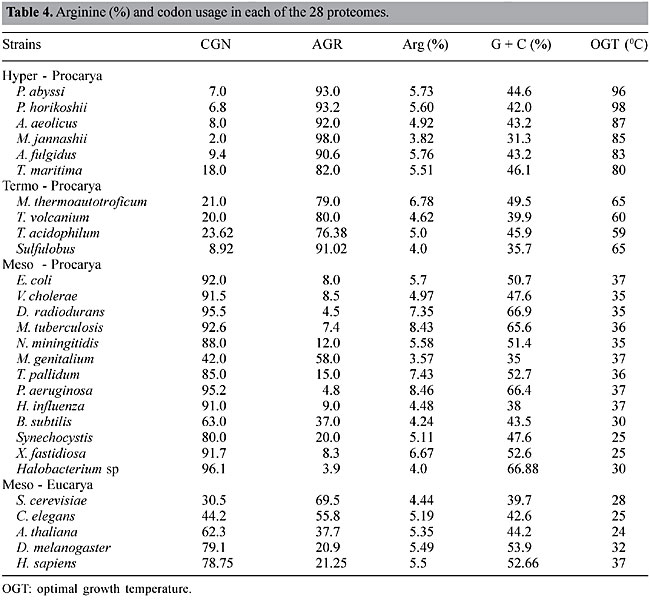
Codon bias for arginine As the preference for one synonymous codon over another in organisms is a well-known phenomenon, we looked for codon bias associated with temperature lifestyles. Striking differences in Arg (R) codons were found between M and the two thermostable groups, HT and T. HT and T had a high preponderance of AGR at the expense of CGN codons (Figure 4), which are more frequent in M. One exception in prokaryotes was Mycoplasma genitalium with 58% AGR and 48% CGN, and in eukaryotes the exceptions were Saccharomyces cerevisiae and Caenorhabditis elegans with 69.5 and 55.8% AGR, respectively (Table 4). Nevertheless the % AGR in these organisms was never as high as in HT and T (Table 4). The % Arg, in the proteome of these organisms, increased with the G + C content (Figure 4), and no correlation was found between the content of Arg and OTG. The preference for CGN codons cannot be attributed to the G + C content, since very different values of CGN were found for similar values of G + C. We compare, for instance, the G + C content in A. aeolicus (43.2%), A. fulgidus (43.2%), T. maritima (46.1%), Sulfolobus sp (35.7%), B. subtilis (43.5%), V. cholerae (47.6%), Synechocystis (47.6%), and H. influenza (38%), with their values for CGN usage, which are 8.0, 9.4, 18.0, 8.9, 63.0, 91.5, 80.0 and 91.0%, respectively (Table 4). There was a superimposed correlation: with similar G + C contents the preference for the synonymous codons was determined by lifestyles, hot or non-hot. Recently, it was suggested that GC content drives codon usage and that the relationship between G + C content and codon and amino acid usage is ahistorical (Knight et al., 2001). Nevertheless, a broader connection, with selective pressure based on the physicochemical properties of the amino acids, might be considered. A transitional mutation in the second position of AGR converts Arg to Lys (AAR), which can be converted to Glu by a transitional mutation in the first position (GAR). All these amino acids have high polar requirements, 9.1, 10.0 and 12.5, respectively, and both Lys and Glu are preferred amino acids in HT organisms. Also, a transitional mutation in the second position of CGY codons converts Arg to His (CAY), which can be converted to Gln (CAR) by a transversional mutation in the third position. Both His and Gln, with similar polar requirements (8.6 and 8.4), are preferred amino acids in mesophilic organisms. The codons AGR (Arg), AAR (Lys) and GAR (Glu), are constituted of RR dinucleotides, whereas the codons CGN (Arg), CAY (His) and CAR (Gln) are constituted mainly of YR and RY dinucleotides. A high correlation (higher than those expected from random combinations of mononucleotides) has been found between both RR and YY, and HT. All these associations, including a preference for AGR and the high E + K/Q + H ratio in HT, could help explain the adaptation of organisms to high temperatures.
ACKNOWLEDGMENTS We thank Romeu C. Guimarães for comments on the manuscript. REFERENCES Cambillau, C. and Claverie, J.M. (2000). Structural and genomic correlates of hyperthermostability. J. Biol. Chem. 275: 32383-32386. Chiusano, M.L., Alvarez-Valin, F., Di Giulio, M., Donofrio, G., Ammirato, G., Colonna, G. and Bernardi, G. (2000). Second codon positions of genes and the secondary structures of proteins. Relationships and implications for the origin of the genetic code. Gene 261: 63-69. Chou, P.Y. and Fasmann, G.D. (1974). Conformational parameters for amino acids in helical, b-sheet, and random coil regions calculated from proteins. Biochemistry 13: 211-222. Ellis, R.J. and van der Vies, S.M. (1991). Molecular chaperones. Annu. Rev. Biochem. 60: 321-347. Haney, P.J., Badger, H.J., Buldak, G.L., Reich, C.I., Woese, C.R. and Olsen, G.J. (1999). Thermal adaptation analyzed by comparison of protein sequences from mesophilic and extremely thermophilic Methanococcus species. Proc. Natl. Acad. Sci. USA 96: 3578-3583. Jaenicke, R. (2000). Do ultrastable proteins from hyperthermophiles have high or low conformational rigidity? Proc. Natl. Acad. Sci. USA 97: 2962-2964. Knight, R.D., Freeland, S.J. and Landweber, L.F. (2001). A simple model based on mutation and selection explains trends in codon and amino-acid usage and GC composition within and across genomes. Genome Biol. 2: research 0010.1-0010.13. Macario, A.J.L., Langer, M., Ahring, B.K. and Macario, E.C. (1999). Stress genes and protein in the Archaea. Microbiol. Mol. Biol. Rev. 63: 923-967. Madigan, M.T., Martinko, J.M. and Parker, J. (1997). Brocks Biology of Microorganisms. Prentice-Hall, Upper Saddle River, NJ, USA. Sicot, F.X., Mesnage, M., Masselot, M., Exposito, J.Y., Garrone, R., Deutsch, J. and Gaill, F. (2000). Molecular adaptation to an extreme environment: Origin of the stability of the Pompeii worm collagen. J. Mol. Biol. 302: 811-820. Szilagyi, A. and Zavodszky, P. (2000). Structural differences between mesophilic, moderately thermophilic and extremely thermophilic protein subunits: results of a comprehensive survey. Structure Fold Des. 8: 493-504. Thompson, M.J. and Eisenberg, D. (1999). Transproteomic evidence of a loop-deletion mechanism for enhancing protein thermostability. J. Mol. Biol. 290: 595-604. Ventriani, C., Maeder, D.L., Tolliday, N., Yip, K.S.P., Stillman, T.J., Britton, K.L., Rice, D.W., Klump, H.H. and Robb, F.T. (1998). Protein thermostability above 100°C: A key role for ionic interactions. Proc. Natl. Acad. Sci. USA 95: 12300-12305. Vieille, C. and Zeikus, G. (2001). Hyperthermophilic enzymes: sources, uses and molecular mechanisms for thermostability. Microbiol. Mol. Biol. Rev. 65: 1-43. Vogt, G., Woell, S. and Argos, P. (1997). Protein thermal stability, hydrogen bonds, and ion pairs. J. Mol. Biol. 269: 631-643. Zierenberg, R.A., Adams, M.W.W. and Arp, A.J. (2000). Life in extreme environments: Hydrothermal vents. Proc. Natl. Acad. Sci. USA 97: 12961-12962. Woese, A.R., Olsen, G.J., Ibba, M. and Söll, D. (2000). Aminoacyl-tRNA synthetases, the genetic code and the evolutionary process. Microbiol. Mol. Biol. Rev. 64: 202-236. |
|