![]()
![]()
![]()
![]()
![]()
![]()
![]()
![]()
![]()
![]()
![]()
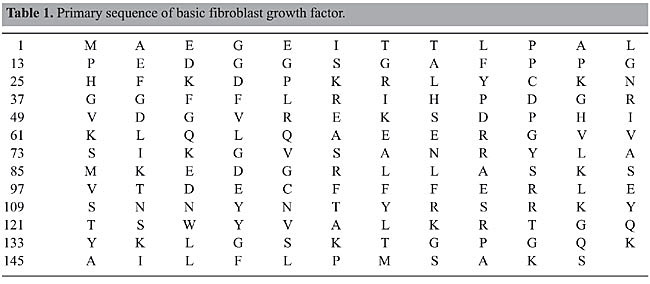
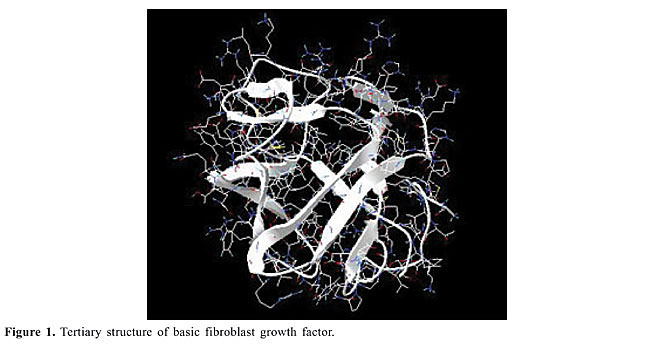
ABSTRACT. The growth of cells is controlled by stimulatory or inhibitory factors. More than twenty different families of polypeptide growth factors have been structurally and functionally characterized. Basic fibroblast growth factor (bFGF) of the fibroblast growth factor family was characterized in 1974 as having proliferative activity for fibroblastic cells. The inhibitory effects of ethanol on cell proliferation result from interference with mitogenic growth factors (e.g., bFGF, EGF and PDGF). In order to better understand the mode of action of bFGF, particularly regarding the influence of ethanol on the biological activity of bFGF, three recombinant bFGF mutants were produced (M6B-bFGF, M1-bFGF and M1Q-bFGF). In the present study, wild bFGF and these mutants were examined by molecular dynamics simulations in systems consisting of a solute molecule in ethanol solution at 298 K and physiological pH over 4.0 ns. The hydrogen bonds, the root mean square deviations and specific radial distribution functions were employed to identify changes in the hydrogen bond structures, in the stability and in the approximation of groups in the different peptides to get some insight into the biological role of specific bFGF regions. The detailed description of the intramolecular hydrogen bonds, hydration, and intermolecular hydrogen bonds taking place in bFGF and its mutants in the presence of ethanol established that the residues belonging to the b5 and b9 strands, especially SER-73(b5), TYR-112(b9), THR-114(b9), TYR-115(b9), and SER-117(b9), are the regions most affected by the presence of ethanol molecules in solution. Key words: Molecular dynamics, Growth factor, Basic fibroblast growth factor INTRODUCTION A cell reproduces by performing an orderly sequence of events in which it duplicates its contents and then divides in two. This cycle of duplication and division, known as the cell cycle, is the essential mechanism by which all living things reproduce. The eukaryotic cell cycle can be subdivided into two main phases: interphase, a long period during which cell contents are duplicated, and mitosis (M-phase), a shorter period during which cell contents are segregated (Reis et al., 2005). Interphase is further divided into S-phase and the gap phases G1 and G2 (Lehninger et al., 1993; Stryer, 1995; Voet and Voet, 1995; Alberts et al., 2002; Cooper, 2004; Reis et al., 2005). The G1-phase involves gene expression and protein synthesis. It allows the cell to grow and produce all the proteins necessary for DNA synthesis. In the second phase, the S-phase, the cell replicates its DNA, which results in two complete DNA strands and leads us to the third phase of the cell cycle, the G2-phase. During this phase, the cell grows again and synthesizes the proteins involved in cell division. Once this phase is completed, the cell enters the fourth phase of the cycle, the M-phase, when the cell undergoes a process known as cytokinesis, by which two new cells are generated, thus completing the cycle (Lehninger et al., 1993; Stryer, 1995; Voet and Voet, 1995; Alberts et al., 2002; Cooper, 2004). However, cell proliferation has to be regulated, since the formation of new cells has to outweigh cell loss by adult tissues. Cells that are not dividing (quiescent) are said to be in the G0-phase. When cells receive external cues to initiate division, they move from the quiescent state into the G1-phase. This regulation occurs via protein interactions, which constitutes the control system that drives and coordinates the cell cycle. In multicellular organisms, this cycle is controlled by highly specific proteins, namely growth factors. These growth factors regulate cell proliferation via a complex network of biochemical cascades which in turn regulate gene transcription and the assembly and dismantling of the control system. Over a hundred growth factors belonging to families of homologue proteins that bind to common receptors are known (Sporn and Roberts, 1991; Cross and Dexter, 1991). One of these families comprises the fibroblast growth factors (FGF), a family consisting of twenty-one members (Schlessinger et al., 2000), of which only nine of them were known up to mid-1997 (Galzie et al., 1997; Venkataraman et al., 1999; Schlessinger et al., 2000). Members of the FGF family bear between 30 and 80% homology, and their factors are designated FGF-1 to FGF-21 (Schlessinger et al., 2000). One member of this family, FGF-2, was named basic fibroblast growth factor (bFGF) because its isoelectric point (pI = 9.6) lies in the basic pH range in aqueous medium (Gallego et al., 1986; Zhang et al., 1991). bFGF is a mitogenic peptide that stimulates the growth and differentiation of a broad spectrum of mesodermal and neuroectodermal cell types, and it is also a powerful agent in tissue repair (Ago et al., 1991; Zhang et al., 1991; Moy et al., 1996). bFGF is of great importance in the embryonic phase because, besides being a primary inducer of mesodermal cell formation, it modulates the proliferation and differentiation of these cells (Galzie et al., 1997; Luo and Miller, 1998). In the adult phase, bFGF also plays a major role in regulating the function and neurological degeneration of adult cells (Galzie et al., 1997; Luo and Miller, 1998). Inappropriate expression of this growth factor may result in the development of tumors as well as other pathologies (Galzie et al., 1997). bFGF is a peptide consisting of a primary sequence of 155 amino acid residues (Table 1) arranged in antiparallel b-strands strongly bound by b-folds (Galzie et al., 1997) (Figure 1).
Studies on synthetic growth factors have revealed that the presence of ethanol may interfere in the action of bFGF, inhibiting neuroectodermal cell proliferation in the embryonic phase (Luo and Miller, 1998). This lack of control may have drastic consequences for the formation of the new individual. Gestational alcohol exposure may result in numerous anomalies regarding fetus formation, the most severe being the manifestation of a disease known as fetal alcohol syndrome. Birth defects related to fetal alcohol syndrome range from craniofacial malformations and growth retardation to intellectual impairment (Luo and Miller, 1998). The effect of ethanol on mitogenic growth factors, especially bFGF, depends on the concentration of this alcohol. For example, studies have revealed that exposure to ethanol at a concentration of 1.21 g/L results in 50% cell growth inhibition, while ethanol at a concentration of 8.00 g/L is sufficient to cause total loss of the bFGF proliferative activity (Luo and Miller, 1998). To date, little is known about the structural elements controlling the biological activities of bFGF (Galzie et al., 1997). One of the methods employed in the identification of the factors determining protein biological activity is site-directed mutagenesis. For instance, one bFGF mutant that has attracted much attention is M6B-bFGF (Presta et al., 1992), which was developed by replacing the four charged residues ARG-118, LYS-119, LYS-128, and ARG-129 with neutral glutamine residues. When compared to wild-type bFGF, M6B-bFGF shows in cultured endothelial cells a similar receptor-binding capacity and mitogenic activity, but a reduced affinity for heparin-like low-affinity binding sites, a reduced chemotactic activity, and a reduced capacity to induce the production of urokinase-type plasminogen activator (Presta et al., 1992). Two other examples of very interesting bFGF mutants are M1-bFGF (Isacchi et al., 1991) and M1Q-bFGF (Presta et al., 1993). The former was developed by removing the residues of the sequence LYS-27 to LEU-32 in bFGF, whereas the latter was obtained by replacing the charged amino acids LYS-27, LYS-30, and ARG-31 with neutral glutamine residues. Under the same experimental conditions, these mutants are at least 100 times less efficient than bFGF in stimulating plasminogen activator production in endothelial cells (Isacchi et al., 1991; Presta et al., 1992). M1-bFGF and M1Q-bFGF bind to bFGF plasma membrane receptor on endothelial cells in a manner undistinguishable from bFGF (Isacchi et al., 1991; Presta et al., 1992). Two regions in the primary structure of 155-amino acid bFGF have been proposed to be involved in the receptor-binding and mitogenic activity (Schubert et al., 1987). They correspond to 33-77 and 115-124 amino acid residue regions (Schubert et al., 1987). Their identification was based on the capacity of synthetic peptides related to these bFGF sequences to interact with bFGF receptor and partially to agonize or antagonize bFGF-induced stimulation of DNA synthesis in 3T3 fibroblasts (Schubert et al., 1987; Baird et al., 1988; Halaban et al., 1988; Walicke et al., 1989; Kaner et al., 1990). Several data support the hypothesis that the 115-124 sequence of bFGF represents the core sequence required for the binding of bFGF to its receptor (Schubert et al., 1987; Baird et al., 1988; Halaban et al., 1988; Walicke et al., 1989; Kaner et al., 1990). Recently, high- and low-affinity receptor binding sites on the bFGF surface have been identified by employing structure based site-directed mutagenesis (Zhu et al., 1997, 1998). According to these studies, the high-affinity site on bFGF includes four hydrophobic residues TYR-33, TYR-112, LEU-149, and MET-151 and two polar residues GLU-105 and ASN-113 on bFGF. The low-affinity site is composed of amino acids LYS-119, TYR-120 and TRP-123, which play an important role in the stimulation of the mitogenic activity. Computer simulations enable us to study the biomolecular system and to predict their properties. Computer simulations and experimental measurements have become complementary tools in the study of biomolecules (van Gunsteren et al., 1994; Degrève and Silva, 2002; Hansson et al., 2002; Fernandez et al., 2004; Namba and Degrève, 2004; Degrève et al., 2004; Murakami et al., 2005). The first one provides a detailed atomic picture at a resolution in space, energy or time that is generally inaccessible by experimental means, whereas the second provides the necessary restriction of the configurational space that has to be sufficiently sampled in a simulation (Guimarães et al., 2004). The aim of the present study was to carry out molecular simulation studies on the effect of the interaction between ethanol molecules and the amino acid residues of bFGF and its mutants, M6B-bFGF, M1-bFGF, and M1Q-bFGF, in order to better understand the structural factors that determine the loss of bFGF activity in the presence of ethanol molecules. COMPUTATIONAL METHODS Molecular dynamics simulation All the results were obtained from molecular simulation using the molecular dynamics method (Alder and Wainwright, 1959; Allen and Tildesley, 1987; Cicotti et al., 1990). The molecular dynamics simulations were carried out with the GROMACS 3.0 molecular dynamics package (Lindahl et al., 2001). The simulated systems consisted of one solute molecule; experimental NMR data (pdb code 1BLA) were used for bFGF and the starting structures for the M6B-bFGF, M1-bFGF and M1Q-bFGF were obtained from the mutation of the NMR crystal structure of the bFGF performed with the “Deep View Swiss-pdb Viewer (Guex and Peitsch, 1997). These initial structures were immersed in water molecules or in a mixed medium of water-ethanol molecules (Table 2). The solvent concentrations were adjusted to match, in the pure solvent regions of the simulation boxes, the experimental solvent density (Table 2). Ions were introduced in the aqueous phases to neutralize the system electrically (Table 2). In this study, we present results obtained at ethanol concentrations of 1.21 g/L (50% decrease in biological activity) and 8.00 g/L (total loss of biological activity). The periodic boundary conditions and minimum image convention were applied (Alder and Wainwright, 1959; Allen and Tildesley, 1987; Cicotti et al., 1990). The Gromos96 force field was used to model all the molecules and interactions (van Gunsteren et al., 1996). The SPC/E model was used for the water molecules. The bond lengths were controlled using the SHAKE constraint algorithm (Allen and Tildesley, 1987) to maintain the rigidity of the solvent molecules. After an initial phase of a 1-ns duration, the molecular dynamics simulations were conducted for 4.0 ns at 298 K and pressure (1 atm) coupling, in a 95 x 95 x 95-nm3 simulation cell, implementing the PME method (Essman et al., 1995) with a cut-off applied at 1.4 nm. The equations of motion were integrated using the Verlet algorithm (Tironi et al., 1995) with a 2.0 fs time step.
Intramolecular hydrogen bonds The identification of intramolecular hydrogen bonds was performed monitoring the hydrogen-acceptor distances: a maximum hydrogen-acceptor distance of 0.235 nm, a minimum donor-hydrogen-acceptor angle of 135° and an occurrence fraction (Fr) greater than 0.1 were adopted as criteria to identify the intramolecular hydrogen bonds. Intermolecular hydrogen bonds The hydrogen bonds between protein atoms and the solvent molecules were characterized using radial distribution functions (RDF) (Alder and Wainwright, 1959; Allen and Tildesley, 1987; Cicotti et al., 1990) and the pair energy distributions (P(E)). The RDF must show a clear definition of a peak in an appropriate region depending on the receptor atom. The P(E) is the pair energy distributions of the interactions between the solute atoms and the solvent molecules. P(E) must show a peak, or a shoulder, in the attractive region (Stillinger and Rahman, 1974; Degrève and Silva, 2002). The number of intermolecular hydrogen bonds, nHB, on the chosen atoms was calculated from the usual integration of the RDF up to its first minimum and by the number of solvent molecules that generate the P(E) peak exclusively if it is located in the attractive energy region. In some cases, when only a shoulder in P(E) was observed in place of a peak, nHB was calculated taking into account all the solvent molecules that showed interaction energies with the selected solute atom, less than or equal to -5.0 kcal/mol. The values of nHB obtained from both procedures were highly consistent. The structural stability of the protein was monitored by means of the root mean square deviation, RMSD, applied either to all residues all along the simulation time or to particular residues as temporal averages. The RMSDs were obtained comparing the positions of selected peptide atoms with the corresponding positions in the starting structures. The IUPAC determination (IUPAC, 1970) for the atom symbols was used to identify the atoms of the bFGF and of its mutants. For example, CO corresponds to the oxygen atoms of the backbone carbonyl groups and NH represents the backbone amide hydrogen. RESULTS AND DISCUSSION The secondary and tertiary structures of bFGF and its mutants obtained by molecular dynamics simulation in ethanol solution consist of twelve antiparallel b-strands held together by small loops. These b-strands form a trigonal pyramid where each of the faces consists of two antiparallel b-strands (face 1: b2-b3, face 2: b6-b7, face 3: b10-b11), whereas the base of this pyramid is composed of the remaining six antiparallel strands (b1-b12, b4-b5, b8-b9) (Figure 1).
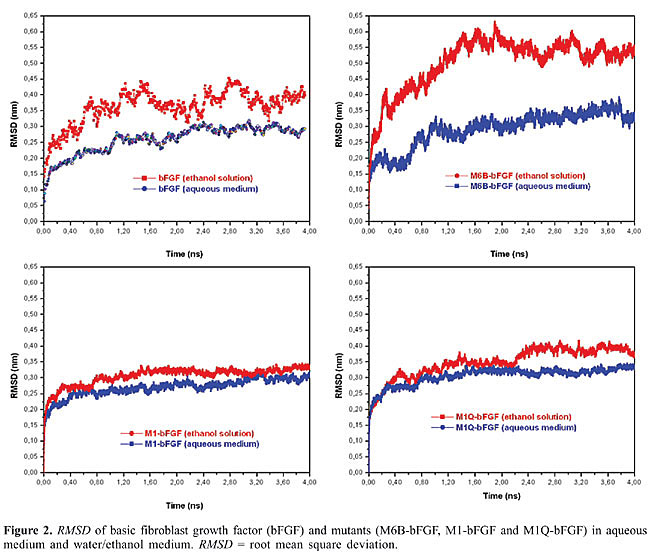
The RMSDs of bFGF, M6B-bFGF, M1-bFGF, and M1Q-bFGF in ethanol solution (Figure 2) show that: · The structure of bFGF in aqueous medium undergoes few changes if compared with the starting NMR structure; the mean RMSD value is 0.25 nm. In ethanol solution, higher RMSDs are observed with a mean value of 0.38 nm (Figure 2). · Similar behavior is displayed by the mutants M6B-bFGF, M1-bFGF, and M1Q-bFGF, which have mean RMSD values of 0.27, 0.25, and 0.30 nm in aqueous medium, respectively. In ethanol solution, the RMSD values are 0.50, 0.33, and 0.35 nm, respectively (Figure 2).
The structural analysis of the main chains by the Ramachandran angles (F and y) (Ramachandran and Sasisekharan, 1968) shows that their behavior in aqueous medium is in excellent agreement with the experimental data (Morris et al., 1992). In ethanolic medium, however, some regions in the b5, b8, and b9 strands of bFGF and M6B-bFGF and of the b1, b5, and b9 strands of M1-bFGF and M1Q-bFGF display deviations from the values found in aqueous medium (Table 3).
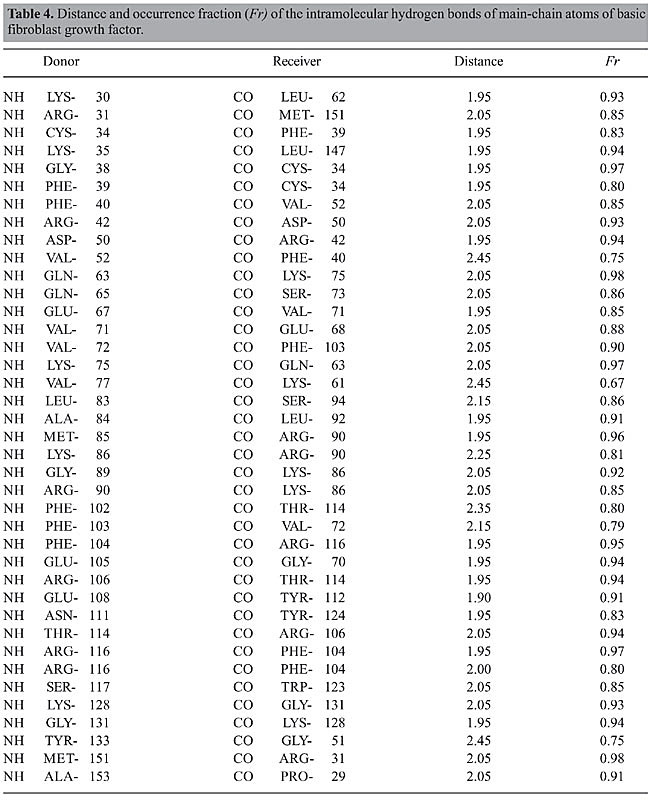
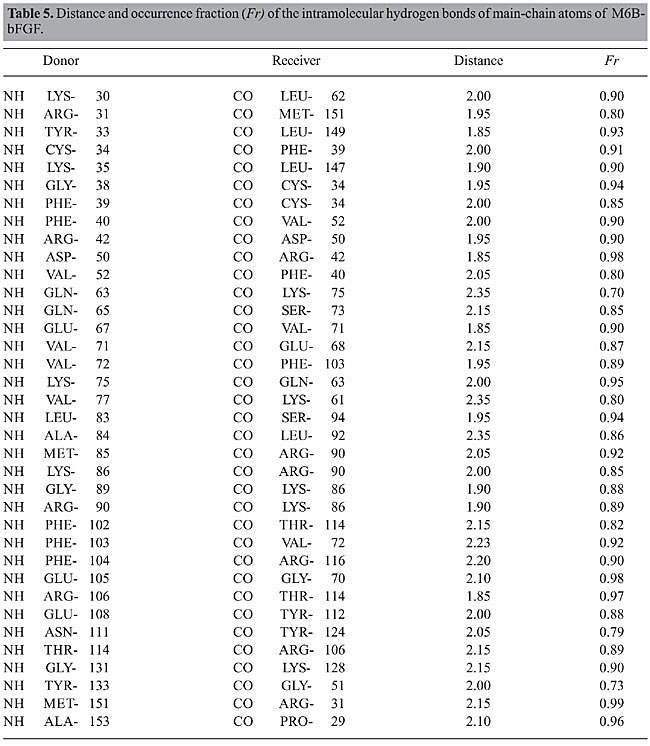
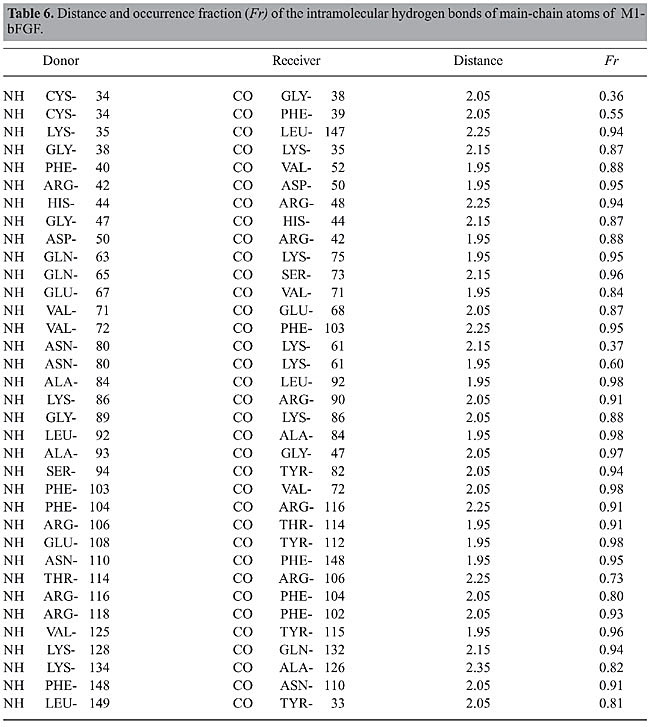
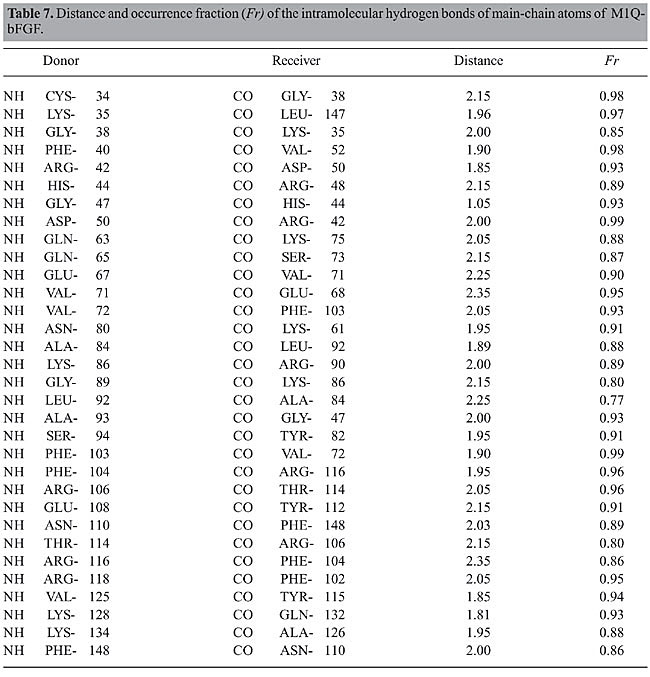
The structures of bFGF and of its mutants in ethanol solution undergo significant changes if compared with their structures in aqueous medium. The increase in all the RMSD values in ethanol solution (Figure 2), as well as the changes in the Ramachandran angles (Table 3), reinforce the assumption that some of these regions exhibit higher flexibility because of the presence of the ethanol molecules in solution. This fact is confirmed in the subsequent analyses. Intramolecular hydrogen bonds Structural characterization of the peptides by molecular dynamics simulations was carried out via identification and monitoring of the intramolecular hydrogen bonds detected throughout the simulations. Tables 4, 5, 6, and 7 show the hydrogen bonds for the main-chain atoms, their respective fraction of occurrence (Fr), and the maximum distances between the proton donor and acceptor of bFGF and its mutants. These results show that the antiparallel b-strands, as well as the whole structure of bFGF, are stabilized by 39 intramolecular hydrogen bonds involving the main-chain atoms (HBintra MC-MC), 31 involving the main-chain atoms and the amino acid side-chain atoms (HBintra MC-SC), and 19 involving bFGF amino acid side-chain atoms only (HBintra SC-SC). As for the bFGF mutants: M6B-bFGF is stabilized by 36 HBintra MC-MC, 27 HBintra MC-SC, and 18 HBintra SC-SC; M1-bFGF by 35 HBintra MC-MC, 25 HBintra MC-SC, and 15 HBintra SC-SC, and M1Q-bFGF by 32 HBintra MC-MC, 25 HBintra MC-SC, and 14 HBintra SC-SC.
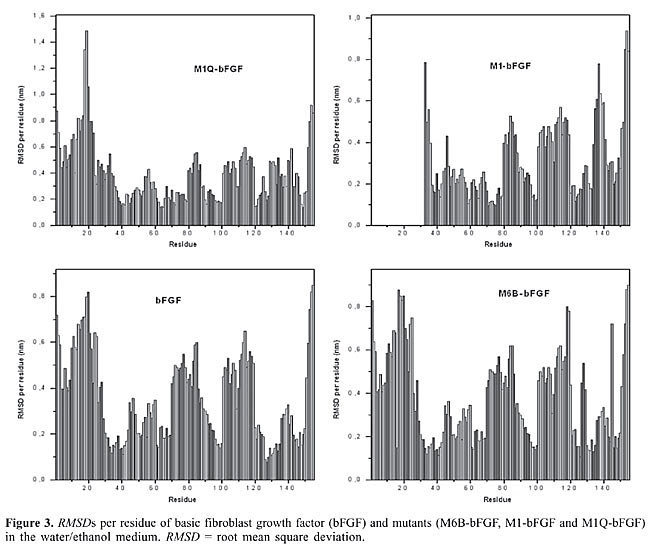
Results from molecular dynamics simulations carried out for bFGF and its mutants show that the two cysteine residues Cys-34 and Cys-101, present in all members of the FGF family and their mutants, do not form a disulfide bridge. Doubt as to whether this disulfide bond was present or not (Galzie et al., 1997) was resolved by deliberately building a disulfide bridge in a “test protein” and constantly monitoring the intramolecular distances between the atoms of these two residues. The RMSD of such a structure shows large deviation from the starting protein, indicating that the disulfide bond does not belong to this protein’s native structure. The fact that there are no disulfide bridges between these two residues is in agreement with experimental results (Galzie et al., 1997) and allows us to conclude that the tertiary structure of these proteins must be stabilized by hydrogen bonding and other intra- and intermolecular electrostatic interactions only. A comparison between the intramolecular hydrogen bonds taking place in the b-strands in the ethanol/water and water media allows one to observe that there are three groups of strands with behaviors that are different in these two kinds of media: · The first group, comprising the b3, b7, b11, and b12 strands of bFGF and M6B-bFGF, and the b3, b4, b6, b7, and b11 strands of M1-bFGF and M1Q-bFGF, maintains a similar number of intramolecular hydrogen bonds. The difference between these numbers is no higher than 0.5, so that these strands do not undergo any changes arising from the presence of ethanol molecules in the solution. · The second group exhibits mild alterations, with differences in the number of intramolecular hydrogen bonds ranging from 0.5 to 2.0. The strands belonging to this group are b1 and b4 in the case of bFGF, b1, b4, and b10 in the case of M6B-bFGF, and b2 in the case of M1-bFGF and M1Q-bFGF. · The third group comprises the b2, b5, b6, b8, b9, and b10 strands of bFGF, the b2, b5, b6, b8, and b9 strands of M6B-bFGF, and the b1, b5, b8, b9, b10, and b12 strands of M1-bFGF and M1Q-bFGF. This group exhibits the largest number of alterations in the presence of ethanol molecules. In ethanol medium, these strands undergo a decrease of 2 to 4 intramolecular hydrogen bonds when compared with the respective strands in aqueous solution. The comparison of the RMSDs per residue (Figure 3) confirms that the regions most destabilized by the presence of ethanol belong to the b5, b6, b8, and b9 strands of bFGF and M6B-bFGF, and to the b1, b5, b8, and b9 strands of M1-bFGF and M1Q-bFGF. These regions were more closely investigated for ethanol interference.
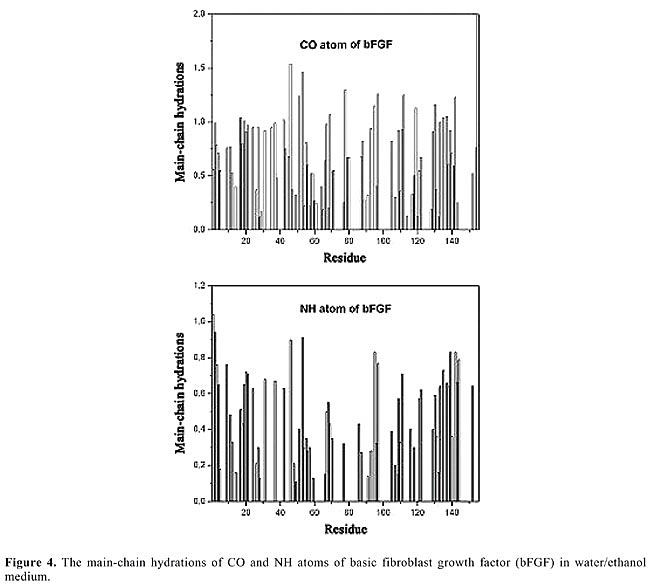
Intermolecular hydrogen bond Hydration Solvent-protein interactions provide helpful information about a protein’s dynamic and thermodynamic properties in biological systems. In recent years, the molecular dynamics method has allowed for considerable progress toward the elucidation of the nature of these interactions (van Gunsteren et al., 1994; Degrève and Silva, 2002; Hansson et al., 2002; Namba and Degrève, 2004; Degrève et al., 2004). The amide and carbonyl groups that form hydrogen bonds with water molecules were analyzed by means of their respective RDFs and energy distributions P(E). The profiles of RDFs of the main-chain atoms of bFGF and its mutants are similar, but intensities can vary. The same remark is valid for the P(E) profiles. The RDFs that identify or do not identify hydrogen bonds are characterized by peaks with maxima ranging from 0.175 to 0.200 nm (NH atoms), and from 0.180 to 0.210 nm (CO atoms). The corresponding maximum intensities vary between 0.20 and 1.85, which reflects the different environments surrounding these groups. The main-chain hydrations indicate that bFGF and its mutants display residues that are very much exposed to the solvent, as is the case for: ASP-46, ARG-53, and ARG-118 in bFGF; ASP-46, ARG-53, ARG-118, LYS-119, LYS-128, and ARG-129 in M6B-bFGF, and TYR-33, ASP-46, ARG-53, HIS-59, LYS-119, and SER-155 in M1-bFGF and M1Q-bFGF. These residues form intermolecular hydrogen bonds only (Figure 4).
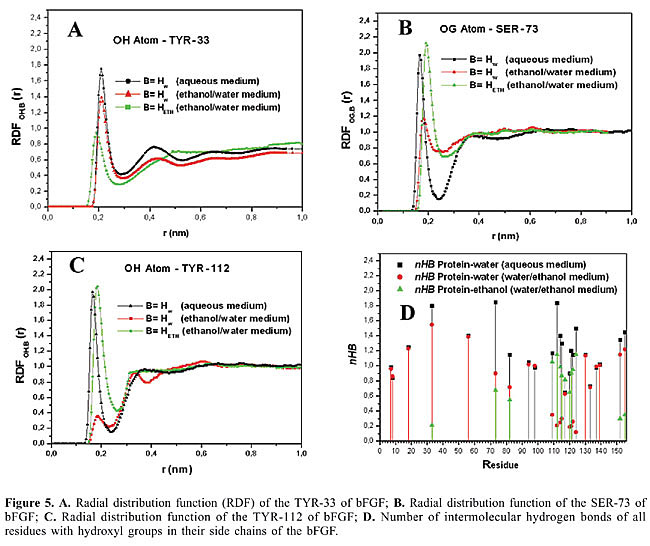
Other residues such as ARG-31, ARG-42, GLU-67, and TYR-133 in bFGF and M6B-bFGF, and ARG-42, GLU-67, ARG-116, and ARG-118 in M1-bFGF and M1Q-bFGF take part in both intramolecular and intermolecular hydrogen bonds (Figure 4). Finally, there are also residues that participate only in intramolecular hydrogen bonds, as well as others that do not form any hydrogen bonds at all (see Tables 4, 5, 6, and 7, and Figure 4). By analyzing the hydration of CO and NH atoms in the main chain of bFGF and its mutants (Figure 4), it can be seen that the water molecules tend to bind to CO atoms rather than NH atoms. In other words, they act as better proton donors than proton acceptors. This tendency is in agreement with results published in the literature (Thanki et al., 1991) and with the fact that the CO atom has two lone electron pairs, whereas the NH atom only bears a small positive charge (0.28e in the Gromos96 force field). A comparison of the hydration changes that occur in bFGF and its mutants in both aqueous and ethanolic media reveals that in all cases there is a decrease in hydration when the protein is in ethanol solution (nHB decrease of 22% for bFGF, 23% for M6B-bFGF, 27% for M1-bFGF, and 27% for M1Q-bFGF). The presence of ethanol mostly affects the hydration of some residues with hydroxyl groups in their side-chains as in the case of the b5, b6, b8, and b9 strands of bFGF and M6B-bFGF, and those of the b5, b6 and b9 strands of M1-bFGF and M1Q-bFGF, especially the side-chain atoms of the residues SER-73(b5), TYR-82(b6), SER-109, THR-112(b9), SER-114(b9), TYR-115(b9), SER-117(b9), TYR-124(b10), and SER-152(b12) (Figure 5).
The hydrophobic effect is the tendency of non-polar species to aggregate in aqueous solution, leading to a decrease in the hydrocarbon-water interfacial area. The side-chains of the amino acids alanine, leucine, valine, proline, isoleucine, phenylalanine, and methionine, present in bFGF and in its mutants, control the formation of intramolecular hydrogen bonds, and the amino acids with nonpolar side-chains are located inside the protein, away from the solvent. In contrast, the external surface of bFGF and its mutants is rich in hydrophilic and charged amino acid residues, especially lysine, arginine, serine, and tyrosine residues which are strongly hydrated, leading to a protein/solvent interface where the intermolecular hydrogen bonds fit the protein’s superficial structure into the water hydrogen bond network. The combination of these two factors produces good stabilization of the protein/solvent contact, and must be responsible for the globular character of bFGF and of its mutants in solution. Solvation by ethanol molecules All RDFs involving ethanol molecules and the protein’s atoms were investigated. The RDF profiles of bFGF and its mutants (ethanol-protein) that identify hydrogen bonds are similar but the intensities vary. The RDFs are characterized by peaks with maxima ranging from 0.185 to 0.210 nm, and the corresponding maximum intensities vary between 1.00 to 2.15, which reflects the different neighborhood of these ethanol molecules. Examples of RDFs are shown in Figure 5; they involve the OH atom of TYR-33, OG atom of SER-73 and OH of TYR-112 and ethanol molecules. The RDFs and P(E) for the ethanol and protein atoms reveal that the ethanol molecules tend to bind to the strands that contain a higher number of residues with hydroxyl groups in their side-chains. bFGF and its mutants display several residues containing hydroxyl groups as is the case of THR-7, THR-8, SER-18, TYR-33, SER-56, SER-73, TYR-82, SER-94, THR-98, SER-109, TYR-112, THR-114, TYR-115, SER-117, TYR-120, THR-121, TYR-122, TYR-124, THR-130, TYR-133, SER-137, THR-139, SER-152, and SER-155. However, ethanol molecules have a preference for specific regions in these proteins (Table 8) since only fourteen of these residues show intermolecular hydrogen bonds with ethanol molecules. In order to check this observation, a molecular dynamics system with a high ethanol concentration (80.0 g/L) was created to investigate and to confirm this preference of the ethanol molecules for these fourteen residues. At this high ethanol concentration, the results demonstrated that the same residues listed in Table 8 are those uniquely responsible for the hydrogen bond formations with ethanol.
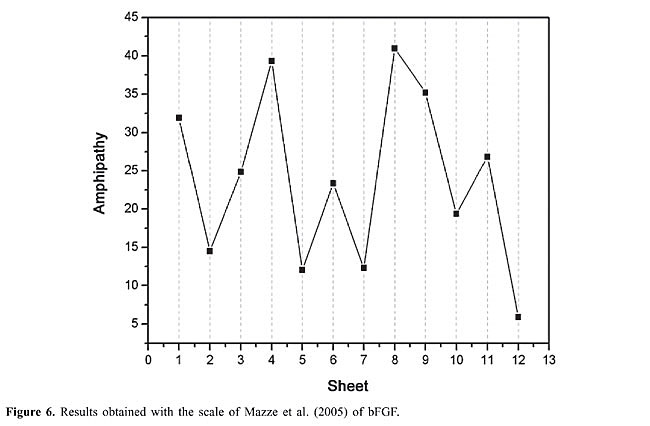
By observing the regions affected by ethanol, one can conclude that the ethanol molecules always affect the same residues in both bFGF and its mutants. In this way, it is possible to understand the reason why ethanol molecules bind to a certain region and not to others. The first step is to monitor the distances between ethanol molecules and protein, RDFs, nHB and the residence time between the ethanol molecules and the residues involved in the intermolecular hydrogen bonds. The second step is to investigate the water molecules that are close to the regions where these bonds occur so that it is possible to classify the behavior of the amino acids that are hydrogen-bonded to ethanol molecules in three different ways: 1. Competition between the ethanol and water molecules to form intermolecular hydrogen bonds as in the case of residues TYR-33(b1), SER-152(b12), and SER-155 (C-terminal end). These cases can be illustrated with the RDF profiles (water molecules-protein) that show in ethanolic medium a moderate reduction in the intensity of the peak (for example, 1.8 to 1.4 for TYR-33 of bFGF) while the RDF peak between ethanol molecules and protein atoms shows a moderate intensity (1.0 for TYR-33 of bFGF) (Figure 5). The nHBs confirm the competition, since these numbers show that the reduction observed in the profiles water-protein in ethanolic medium is proportional to the increase in the ethanol-protein peak in this medium (Figure 5 and Table 8). Another confirmation of this notion can be obtained from the residence time of ethanol molecules which demonstrates that the ethanol molecules remain between 26 to 39% of the simulation time bonded to these residues (Table 8). This occurs probably because these amino acids lie close to the N- (TYR-33) and C-terminal ends (SER-152 and SER-155), which renders these regions more mobile. Thus, the intense movement in this region makes the water and ethanol molecules shift places, suggesting that these residues are not very important in understanding the decrease in activity due to the ethanol molecules. 2. An ethanol molecule replaces a water molecule which withdraws from the region, while the ethanol molecule remains in direct contact with the protein. This is observed in the regions lying close to the residues SER-73(b5) and TYR-82(b6). The behavior is confirmed with the RDF profiles and nHB involving these residues and water or ethanol molecules in the water/ethanol medium. These RDFs almost show a reduction of 50% in the intensity (for example 1.95 to 1.15 in the case of SER-73) (Figure 5), while the RDFs between protein and ethanol molecules display an intense and defined peak (2.15 in the case of SER-73) (Figure 5). The residence time of the ethanol molecules in the neighborhood of these amino acids shows that the ethanol molecule remains around 50% of the time bonded to these residues (Table 8). 3. The ethanol molecules remain all along the simulation close to some residues where the hydrogen bonds form in the regions of the residues SER-109, TYR-112(b9), THR-114(b9), TYR-115(b9), SER-117(b9), TYR-120, THR-121, SER-122, and TYR-124(b10). The ethanol molecules remain in these regions throughout a great part of the simulation and do not allow the approach of water molecules. The residence time of the ethanol molecules that are hydrogen bonded to these residues confirms that during approximately 73% of the time the ethanol molecules are close to these residues (Table 8). The RDFs and nHB reaffirm this hypothesis. Therefore, the RDF (water-protein) profiles in water/ethanol medium show a great reduction in the intensity (for example 1.98 to 0.35 in the case of TYR-112) and the RDFs (ethanol-protein) show a very intense and defined peak (2.05 for TYR-112) (Figure 5 and Table 8). This fact occurs because all these residues containing hydroxyl groups are spatially very close to regions of hydrophobic character (b8). The intense interference of the ethanol molecules with the SER-109, TYR-112(b9), THR-114(b9), TYR-115(b9), SER-117(b9), TYR-120, THR-121, SER-122, and TYR-124(b10) residues suggests that these residues are important in understanding the decrease in the biological activity of bFGF. Other pertinent information about the structure of bFGF and its mutants is given by using the amphipathy scale. Results obtained with the amphipathy coefficients (AC) of the scale by Mazzé et al. (2005) (Figure 6) show that the b4, b8, and b9 strands are the regions with the highest amphipathy; thus, they are very susceptible to forming intermolecular hydrogen bonds through their side-chains. On the other hand, the amphipathy of the b2, b5, b7, and b12 strands is low, which is an indication that the main chains must be solvated. Therefore, according to the amphipathy analysis along the chain, the ethanol molecules must bind to the side-chains of the b4, b8, and b9 strands, and to the main chains of the b2, b5, b7, and b12 strands. In fact, the amino acids of the b5 strands lose bonds of the NH-CO type, and the b8 and b9 also lose intramolecular hydrogen bonds involving the amino acid side-chain atoms.
In all cases, the ethanol molecules approach the amino acid residues that contain a hydroxyl group only if they are located in the neighborhood of other residues displaying a hydrophobic character. This fact is due to the energetically favorable situation that takes place when the ethanol molecules are hydrogen bonded to hydroxyl groups while their methyl group is accommodated in a hydrophobic environment, thus minimizing the contact between this methyl group and water molecules. In the case of bFGF (Table 8 and Figure 5), the ethanol molecules form intermolecular hydrogen bonds with: · the residue TYR-33(b1), which is next to the amino acid LEU-32 and is spatially close to the amino acid residues of the b12 strand (very low AC with values between 1.5 to 10.1), which in turn exhibits a high hydrophobic character (LEU-147, PHE-148, LEU-149, PRO-150, MET-151, and ALA-153) (Table 8). · the residue SER-73(b5), which is located between VAL-71 (AC = 3.8), VAL-72 (AC = 3.8) and ILE-74 (AC = 4.9), all of which have a nonpolar character (Table 8). · the residue TYR-82(b6), which precedes the residues LEU-83 (AC = 5.1), ALA-84 (AC = 1.5), and MET-85 (AC = 5.9) and is close to the hydrophobic environment conferred by the amino acids on the b7 strand (Table 8). · the region around the residues SER-109, THR-112(b9), SER-114(b9), TYR-115(b9), and SER-117(b9), located at the end of loop 9 and along all the length of the b9 strand, forms a region of polar character, spatially close to another region, b8 (AC from 5.1 to 10.1) consisting of hydrophobic residues (PHE-102, PHE-103, PHE-104, and LEU-107), where all these residues form hydrogen bonds with ethanol molecules (Table 8). · the residue TYR-124(b10) surrounded by the nonpolar amino acids TRP-123 (AC = 15.1), VAL-125 (AC = 3.8), ALA-126 (AC = 1.5), and LEU-127 (AC = 5.1) (Table 8). · the residues SER-152(b12) and SER-155 (C-terminal end), which come after an extremely hydrophobic region formed by residues ALA-145, ILE-146, LEU-147, PHE-148, LEU-149, PRO-150, MET-151, and ALA-153 (AC with values between 1.5 to 10.1) (Table 8). In the case of M6B-bFGF (Table 8), the ethanol molecules behave in a very similar way when compared with bFGF. This mutant exhibits all the intermolecular hydrogen bonds reported for bFGF, except for the bonds between the ethanol molecules and the residues SER-117, TYR-120, THR-121, and TYR-124 (Table 8). M6B-bFGF does not form these four intermolecular hydrogen bonds because these four residues lie close to the mutagenized area in this protein, where the charged residues ARG-118, LYS-119, LYS-128, and ARG-129 were replaced with neutral glutamine residues. M1-bFGF and M1Q-bFGF also display all the intermolecular hydrogen bonds reported for bFGF, except for the bonds between ethanol molecules and the residues TYR-33 and SER-155 (Table 8). The former intermolecular hydrogen bond is not observed because the residue TYR-33 is located very close to the mutagenized regions in both mutants (LYS-27 to LEU-32 in the case of M1-bFGF; LYS-27, LYS-30, and ARG-31 in the case of M1Q-bFGF). The latter intermolecular hydrogen bond does not occur because SER-155 belongs to the C-terminus (an area of vigorous movement throughout the simulation, see RMSD per residue; Figure 3), and it lies spatially close to the b1 strand (the mutagenized region). Therefore, as in the case of proteins in aqueous medium, SER-155 is affected by the mutation in these proteins, leading to the loss of this intermolecular hydrogen bond. Overall, ethanol molecules affect the structure of bFGF and its mutants, as shown by the analyses carried out herein. Our studies showed evidence that the RMSDs of all the structures increase in ethanol, and that alterations in the Ramachandran angles occur in all the proteins, especially in the b1, b5, b8, and b9 strands. Analysis of the intramolecular hydrogen bonds pointed out that the b2, b5, b6, b8, and b9 strands of bFGF and M6B-bFGF, as well as the b1, b5, b8, b9, and b10 strands of M1-bFGF and M1Q-bFGF, lose the highest number of bonds. The RMSDs per residues showed that the b5, b6, b8, and b9 strands of bFGF and M6B-bFGF, and the b1, b5, b8, and b9 strands of M1-bFGF and M1Q-bFGF are the strands with the largest deviations. We also demonstrated that hydration of these proteins occurs, with greatest loss of intermolecular hydrogen bonds occurring in the residues belonging to the b5, b6 and b9. Analysis by means of the amphipathy scale led to the conclusion that the addition of ethanol may be of considerable consequence to the side chains of the amino acids belonging to the b4, b8, and b9 strands and to the main chain of the amino acids present in the b2, b5, b7, and b12 strands. Solvation by ethanol molecules showed more active interference of ethanol with the residues belonging to the b5, b6, b8, and b9 strands. On the basis of these results, it is possible to conclude that all differences encountered in bFGF and its mutants due to the presence of ethanol molecules in solution share three common points: 1. b5, b6, and b9 strands are the regions that are most influenced by the presence of ethanol molecules. 2. b5 and b9 strands are the only regions that are affected by ethanol in all analyses carried out herein, particularly the residues SER-73(b5), TYR-112(b9), THR-114(b9), TYR-115(b9), and SER-117(b9). In fact, experimental studies carried out in aqueous medium show evidence that residues from the sequence 115-124 (Zhu et al., 1997), and especially TYR-112(b9) and ASN-113(b9), are essential for bFGF binding to its receptor (Springer et al., 1994; Zhu et al., 1997, 1998). 3. The solvation of the residues TYR-112(b9) and the intramolecular hydrogen bond of ASN-113(b9) in bFGF and its mutants are strongly influenced by the presence of ethanol. In the case of ASN-113(b9), there is loss of an intramolecular hydrogen bond. As for TYR-112(b9), it forms a direct intermolecular hydrogen bond with ethanol in the case of bFGF and all its mutants. This hydrogen bond was one of the most conserved during the simulation time (residence time of 3.05 ns). This analysis suggests that the substitution of a water molecule by an ethanol molecule in the solvation shell of SER-73(b5), TYR-112(b9), THR-114(b9), TYR-115(b9), and SER-117(b9) is a key point in understanding the decrease in biological activity of these growth factors leading to inhibition of neuroectodermal cell proliferation in the embryonic phase. The ethanol interference in SER-73(b5), TYR-112(b9), THR-114(b9), TYR-115(b9), and SER-117(b9) observed in bFGF and in all its mutants must also be correlated with the activity loss of the peptides. However, the fact that experimental data indicate that TYR-112 and ASN-113(b9) are essential for bFGF binding to its receptor (Springer et al., 1994; Zhu et al., 1997, 1998), confirmed by the molecular simulation results, does not discount the need for more extended studies on the role of the SER-73(b5), THR-114(b9), TYR-115(b9), and SER-117(b9) residues in bFGF activity. CONCLUSION On the basis of the detailed description of the intramolecular hydrogen bonds, hydration, and intermolecular hydrogen bonds taking place in bFGF and its mutants in the presence of ethanol, it was possible to establish that the residues belonging to the b5 and b9 strands, especially SER-73(b5), TYR-112(b9), THR-114(b9), TYR-115(b9), and SER-117(b9), are extremely important for the proliferative activity of neuroectodermal cells in the embryonic phase. However, the lack of experimental data on the influence of the SER-73(b5), THR-114(b9), TYR-115(b9), and SER-117(b9) residues indicates that further studies of bFGF activity are warranted. ACKNOWLEDGMENTS Research supported by Fundação de Amparo à Pesquisa do Estado de São Paulo (FAPESP) and the Conselho Nacional de Desenvolvimento Científico e Tecnológico (CNPq). REFERENCES Ago H, Kitagawa Y, Fujishima A, Matsuura Y, et al. (1991). Crystal structure of basic fibroblast growth factor at 1.6 Å resolution. J. Biochem. 110: 360-363. Alberts B, Johnson A, Lewis J, Raff M, et al. (2002). Molecular biology of the cell. 4th edn. Garland Science, New York, NY, USA. Alder BJ and Wainwright TE (1959). Studies in molecular dynamics. I. General method. J. Chem. Phys. 31: 459-466. Allen MP and Tildesley DJ (1987). Computer simulation of liquids. 1st edn. Oxford University Press, New York, NY, USA. Baird A, Schubert D, Ling N and Guillemin R (1988). Receptor- and heparin-binding domains of basic fibroblast growth factor. Proc. Natl. Acad. Sci. USA 85: 2324-2328. Cicotti G, Frenkel D and McDonald IR (1990). Simulation of liquids and solids. 1st edn. North-Holland Publishing Co., Amsterdam, Netherlands. Cooper GM (2004). The cell: A molecular approach. 3rd edn. ASM Press, Washington, DC, WA, USA. Cross M and Dexter TM (1991). Growth factors in development, transformation, and tumorigenesis. Cell 64: 271-280. Degrève L and Silva LB (2002). Effect of the deletion of the C region on the structure and hydration of insulin-like growth factor 1: a molecular dynamics investigation. Mol. Phys. 100: 3111-3122. Degrève L, Brancaleoni GH, Fuzo CA, Lourenzoni MR, et al. (2004). On the role of water in the protein activity. Braz. J. Phys. 34: 102-115. Essman U, Perela L, Berkowitz ML, Darden T, et al. (1995). A smooth particle mesh Ewald method. J. Chem. Phys. 103: 8577-8592. Fernandez J, Neshich G and Camargo ACM (2004). Using bradykinin-potentiating peptide structures to develop new antihypertensive drugs. Genet. Mol. Res. 3: 554-563. Gallego GG, Conn G, Hatcher VB and Thomas KA (1986). Human brain-derived acidic and basic fibroblast growth factors: amino terminal sequences and specific mitogenic activities. Biochem. Biophys. Res. Commun. 135: 541-548. Galzie Z, Kinsella AR and Smith JA (1997). Fibroblast growth factors and their receptors. Biochem. Cell Biol. 75: 669-685. Guex N and Peitsch MC (1997). SWISS-MODEL and the Swiss-PdbViewer: an environment for comparative protein modeling. Electrophoresis 18: 2714-2723. Guimarães CRW, Barreiro G, Oliveira CAF and Alencastro RB (2004). On the application of simple explicit water models to the simulations of biomolecules. Braz. J. Phys. 34: 126-136. Halaban R, Langdon R, Birchall N, Cuono C, et al. (1988). Basic fibroblast growth factor from human keratinocytes is a natural mitogen for melanocytes. J. Cell Biol. 107: 1611-1619. Hansson T, Oostenbrink C and van Gunsteren WF (2002). Molecular dynamics simulations. Curr. Opin. Struct. Biol. 12: 190-196. Isacchi A, Statuto M, Chiesa R, Bergonzoni L, et al. (1991). A six-amino acid deletion in basic fibroblast growth factor dissociates its mitogenic activity from its plasminogen activator-inducing capacity. Proc. Natl. Acad. Sci. USA 88: 2628-2632. IUPAC (1970). IUPAC-IUB Comission on Biochemical Nomenclature. Abbreviations and symbols for the description of the conformation of polypeptide chains. Tentative rules (1969). Biochemistry 9: 3471-3479. Kaner RJ, Baird A, Mansukhani A, Basilico C, et al. (1990). Fibroblast growth factor receptor is a portal of cellular entry for herpes simplex virus type 1. Science 248: 1410-1413. Lehninger AL, Nelson DL and Cox MM (1993). Principles of biochemistry. 2nd edn. Worth Publishers, New York, NY, USA. Lindahl E, Hess B and van der Spoel D (2001). GROMACS 3.0: A package for molecular simulation and trajectory analysis. J. Mol. Mod. 7: 306-317. Luo J and Miller MW (1998). Growth factor-mediated neural proliferation: target of ethanol toxicity. Brain Res. Rev. 27: 157-167. Mazzé FM, Fuzzo CA and Degreve L (2005). A new amphipathy scale. I. Determination of the scale from molecular dynamics data. Biochim. Biophys. Acta (BBA) - Protein Struct. Mol. Enzymol.1747: 35-46. Morris AL, MacArthur MW, Hutchinson EG and Thornton JM (1992). Stereochemical quality of protein structures. Proteins 12: 345-364. Moy FJ, Seddon AP, Bohlen P and Powers R (1996). High-resolution solution structure of basic fibroblast growth factor determined by multidimensional heteronuclear magnetic resonance spectroscopy. Biochemistry 35: 13552-13561. Murakami MT, Arni RK, Vieira DS, Degreve L, et al. (2005). Correlation of temperature induced conformation change with optimum catalytic activity in the recombinant G/11 xylanase A from Bacillus subtilis strain 168 (1A1). FEBS Lett. 579: 6505-6510. Namba AM and Degreve L (2004). Estudo da estrutura e da solvatação do HNP-3, um antibiótico natural, por dinâmica molecular. Quim. Nova 27: 27-34. Presta M, Statuto M, Isacchi A, Caccia P, et al. (1992). Structure-function relationship of basic fibroblast growth factor: site-directed mutagenesis of a putative heparin-binding and receptor-binding region. Biochem. Biophys. Res. Commun. 185: 1098-1107. Presta M, Gualandris A, Urbinati C, Rusnati M, et al. (1993). Subcellular localization and biological activity of M(r) 18,000 basic fibroblast growth factor: site-directed mutagenesis of a putative nuclear translocation sequence. Growth Factors 9: 269-278. Ramachandran GN and Sasisekharan V (1968). Conformation of polypeptides and proteins. Adv. Protein Chem. 23: 283-438. Reis VCB, Torres FAG, Poças-Fonseca MJ, De-Souza MT, et al. (2005). Cell cycle, DNA replication, repair, and recombination in the dimorphic human pathogenic fungus Paracoccidioides brasiliensis. Genet. Mol. Res. 4: 232-250. Schlessinger J, Plotnikov AN, Ibrahimi OA, Eliseenkova AV, et al. (2000). Crystal structure of a ternary FGF-FGFR-heparin complex reveals a dual role for heparin in FGFR binding and dimerization. Mol. Cell 6: 743-750. Schubert D, Ling N and Baird A (1987). Multiple influences of a heparin-binding growth factor on neuronal development. J. Cell Biol. 104: 635-643. Sporn MB and Roberts AB (1991). Peptide growth factors and their receptors. 1st edn. Springer-Verlag, New York, NY, USA, pp. 69-171. Springer B, Pantoliano M, Barbera F, Gunyuzlu P, et al. (1994). Identification and concerted function of two receptor binding surfaces on basic fibroblast growth factor required for mitogenesis. J. Biol. Chem. 269: 26879-26884. Stillinger FH and Rahman A (1974). Improved simulation of liquid water by molecular dynamics. J. Chem. Phys. 60: 1545-1557. Stryer L (1995). Biochemistry. 4th edn. W.H. Freeman and Company, New York, NY, USA. Thanki N, Umrania Y, Thornton JM and Goodfellow JM (1991). Analysis of protein main-chain solvation as a function of secondary structure. J. Mol. Biol. 221: 669-691. Tironi IG, Sperb R, Smith PE and van Gunsteren WF (1995). A generalized reaction field method for molecular dynamics simulations. J. Chem. Phys. 102: 5451-5459. van Gunsteren WF, Luque FJ, Timms D and Torda A (1994). Molecular mechanics in biology: from structure to function, taking account of solvation. Annu. Rev. Biophys. Biomol. Struct. 23: 847-863. van Gunsteren WF, Billeter SR, Eising AA, Hünenberger PH, et al. (1996). Biomolecular simulation: The GROMOS 96 manual and user guide. Biomos, Groeningen. Venkataraman G, Shriver Z, Davis JC and Sasisekharan R (1999). Fibroblast growth factors 1 and 2 are distinct in oligomerization in the presence of heparin-like glycosaminoglycans. Proc. Natl. Acad. Sci. USA 96: 1892-1897. Voet D and Voet JG (1995). Biochemistry. 2nd edn. J. Wiley and Sons, New York, NY, USA. Walicke PA, Feige JJ and Baird A (1989). Characterization of the neuronal receptor for basic fibroblast growth factor and comparison to receptors on mesenchymal cells. J. Biol. Chem. 264: 4120-4126. Zhang J, Cousens LS, Barr PJ and Sprang S (1991). Three-dimensional structure of human basic fibroblast growth factor, a structural homolog of interleukin 1 beta. Proc. Natl. Acad. Sci. USA 88: 3446-3450. Zhu H, Anchin J, Ramnarayan K, Zheng J, et al. (1997). Analysis of high-affinity binding determinants in the receptor binding epitope of basic fibroblast growth factor. Protein Eng. 10: 417-421. Zhu H, Ramnarayan K, Menzel P, Miao Y, et al. (1998). Identification of two new hydrophobic residues on basic fibroblast growth factor important for fibroblast growth factor receptor binding. Protein Eng. 11: 937-940. |
|