![]()
![]()
![]()
![]()
![]()
![]()
![]()
![]()
![]()
![]()
![]()
ABSTRACT. Models for estimation of frame scores in Nellore beef cattle (FRAME_GMA) were developed, comparing them with frame scores estimated using equations proposed by the Beef Improvement Federation (FRAME_BIF, USA). Correlation among frame scores obtained by these two methodologies, along with the independent variables considered in the estimation models, were also studied. A data set with 12,728 animals, with ages between 490 and 610 days, was used. The models that best adjusted to FRAME_GMA included hip height, weight and interaction between height and weight. Estimates of heritability for FRAME_GMA and FRAME_BIF were 0.26 ± 0.03 and 0.23 ± 0.03, respectively, in single trait analysis, and 0.28 and 0.24, respectively, in multi-trait analysis. Phenotypic Pearson and Spearman correlation coefficients between FRAME_GMA and FRAME_BIF for males were 0.87 and 0.83, respectively, being lower than those found for females (0.92 for both coefficients). Genetic correlation between the frame scores did not differ between genders, with values of 0.92 for the Pearson coefficient and 0.91 for the Spearman coefficient. We concluded that FRAME_GMA was better adapted to this data set than FRAME_BIF. Other studies need to be made to evaluate the applicability of this proposed model to other populations of Nellore beef cattle and for other age groups. Key words: Genetic parameters, Frame scores, Body structure, Nellore, Genetic improvement INTRODUCTION The correlations reported among various features of body structure, such as hip height, and the reproductive and growth performance of beef cattle, have promoted the inclusion of measurements associated with size, mass and dimension of the animals in genetic improvement programs for more accurate investigation of genetic and environmental effects on adult body structure (Vargas et al., 1999; Mercadante et al., 2003). To facilitate interpretation and applicability, hip height measures are frequently converted into body structure scores or frame scores. The frame score is a linear measurement that indicates the composition of the animal’s frame; animals that present the same frame scores, slaughtered at the same weight, should have the same carcass type (Beef Improvement Federation, 2002). As it gives a numeric and objective description of the body structure, the frame score reflects the animal’s growth pattern, projecting the adult size. The knowledge about correlations between frame score and growth rate, or composition of the weight gain is important for beef cattle management, allowing analysis of related performance data. It helps to predict the animal’s nutritional needs and its frame composition. Animals with low frame scores reach physiological maturity more precociously; they have lower weights and a higher percentage of fat in the frame (including marbled fat), when compared to large-frame animals (McKiernan, 2005). Theoretically, an animal maintains its frame throughout its life. Changes in frame scores may be influenced by environmental factors or by inconsistent handling practices, which alter the animal’s growth rate, promoting differentiated growth (Dhuyvetter, 1995). Although subject to environmental interference, the stability of frame scores is an advantage in comparison with the use of other variables that are indicative of size, such as adult weight, or age-dependent height, and one can evaluate the frame score once, at an early age. In Brazil, frame scores have been calculated subjectively, through visual evaluations or using the equations provided by the American Beef Improvement Federation (2002), that include the independent variables hip height and age at measurement, as in Mercadante et al. (2004). However, these equations may not be appropriate for Brazilian cattle, considering that they have been developed based on records of animals that have been raised under adverse conditions, which is a common situation in the Brazilian tropical beef cattle industry. The development of a mathematical model for estimating the frame scores in beef cattle, taking into consideration typical Brazilian management practices and production systems, is essential to consolidate this feature as a tool for breeders in their selection decisions (Horimoto, 2005). The objectives of the present study were: i) to develop mathematical models for estimating frame scores in Nellore beef cattle, raised in Brazil; ii) to make comparisons between these frame scores and the score proposed by the American Beef Improvement Federation (2002); iii) to estimate (co)variance components and the genetic parameters for the frame scores obtained through both methods and yearling hip height (H18), yearling weight (W18) and the weaning weight (WW), using the mixed model methodology, and iv) to determine the coefficients of phenotypic and genetic correlation between frame scores and each of the variables of the models for estimating frame scores. MATERIAL AND METHODS Data were obtained on WW, yearling weight, measured at 18 months of age (W18) and hip height, also measured at 18 months of age (H18) of 12,728 Nellore calves, from two farms owned by Agro-Pecuária CFM Ltda., located in the Mid-Northwestern area of the State of São Paulo. The animals, 6,597 males and 6,131 females, were born from 1995 to 2000. The additive relationship matrix considered 30,081 animals and up to seven discrete generations. Although the features of this study may be considered as yearling features, the measurements were taken in intervals from 490 to 610 days, using the management calendar of the farm’s breeding program. Outlier data were eliminated from the data set, based on the Central Limit Theorem. For the composition of the contemporary groups, the non-genetic factors considered were: farm, birth year, sex, and handling group. Statistical analysis was made with the PROC GLM procedure of the Statistical Analysis System®, version 8.02 (SAS, 2000). The contemporary groups that could negatively interfere in the quality of the analysis were eliminated from the data base, considering the criteria: groups of less than four animals, groups formed by animals generated by a single bull and without any variability (standard deviation zero). The animals were grouped by gender into four weight ranks (W18) and 3 hip height ranks (H18), totaling 12 weight-hip height ranks, each one being related to an empirical frame score, denominated FRAME_AT (Table 1). The attribution of the frame scores was performed in a way that they rose to a common rank of H18, observing the W18 rank. This was done in this way due to the strong relationship between the frame criterion and animal height, as it is expected that larger frame animals should also be taller.
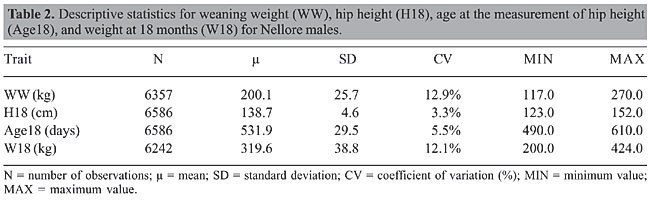
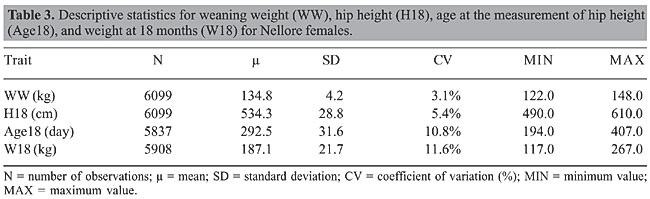
Several models were tested for the dependent variable FRAME_AT, including linear and quadratic effects of the independent variables H18, W18 and age when the hip height was measured (Age18) and the product among them, according to the PROG REG procedure of the Statistical Analysis System®, version 8.02 (SAS, 2000), in order to obtain the best adjustment for the estimation of the frame scores. The choice of the model that best adjusted was determined by the analysis of the statistic variables R2 (coefficient of determination), C(p), defined by MacNeil (1983) and residual mean squares (RMS). The models defined by regression from the FRAME_AT scores were applied to the data set, for estimation of frame scores (FRAME_GMA), which was based on the observations on the variables from the models. The application of the equations recommended by the Beef Improvement Federation (2002), using the same data set, originated the FRAME_BIF scores. Rounded integer values of FRAME_GMA and FRAME_BIF were used for estimation of the genetic parameters. Phenotypic Pearson and Spearman correlation coefficients for whole and decimal values were estimated. Single trait analysis was used for FRAME_GMA, FRAME_BIF, H18, W18, and WW; multi-trait analysis was done between each frame score and the variables W18 and WW, using restricted maximum likelihood procedures on animal models, available from the Multiple Trait Derivative Free Restricted Maximum Likelihood program (MTDFREML, Boldman et al., 1995). The models of analysis considered the fixed effects of contemporary groups and age of dam classes. The genetic effects included a vector of random effects from the models, including direct addictive genetic effects for the FRAME_BIF, FRAME_GMA, H18, and W18 features, and maternal additive genetic effects and permanent environmental effects for WW. Co-variables for the genetic analysis of ages at the measurement dates included: age at weaning, age at hip height measurement and age at weight at 18 months. The initial values of the variance components used for the genetic single trait analysis were estimated through the PROC VARCOMP procedure from the Statistical Analysis System®, version 8.02 (SAS, 2000). The estimates of co-variance obtained from the single trait analysis were used as initial values for the multi-trait analysis. To determine the reliability and the appropriateness of the proposed models for the estimation of FRAME_GMA, correlation Pearson and Spearman coefficients were calculated between the phenotypic and genetic values obtained for FRAME_GMA and for FRAME_ BIF and for each of the frame scores and their respective independent variables considered in both functions (SAS, 2000). RESULTS AND DISCUSSION The descriptive statistics for WW, H18, Age18, and W18 are shown in Tables 2 and 3 for males and females, respectively.
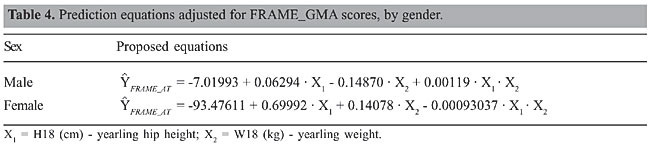
Using the criteria adopted for empirical attribution of the frame scores, FRAME_AT scores were estimated for each of the 12,728 animals. Males and females gave mean FRAME_ AT scores of 7.1 ± 2.1 and 5.3 ± 2.4, respectively. There was a high frequency, over 60%, of scores 6 and 7 in both sex groups. In the male group, 21% of the scores were 11 and 12, and in the female group, there was 21% score 2. The models that best adjusted for determining frame scores, based on the parameters R2, C(p) and RMS, are presented in Table 4. The determination coefficient (R2) obtained was 0.82 for the males and 0.76 for the females, indicating a significative adherence of these models to the data set.
Although the variable Age18 had a significant effect, based on the statistical analysis C(p) and RMS, the effect on the R2 statistic, around 1% for males and 0.3% for females does not justify its inclusion in the estimation of the frame scores. The application of the models shown in Table 4 to the data set, generated 12,635 FRAME_GMA scores. Based on those estimates, 1.92% went outside the defined rank from 1 to 12 for the variation of frame scores, equalizing values <1, observed for males and females, and >12 for males. These figures were added to the rank of the defined scores, with the scores <1, except for zero being indicated as 1, and the scores >12, were designated as 12. This procedure was based on the high coefficients of phenotypic Pearson and Spearman coefficients obtained between the FRAME_GMA scores before and after the calculations, ordered as 0.99 for both gender groups. The descriptive statistics for the FRAME_GMA scores by sex are presented in Table 5.
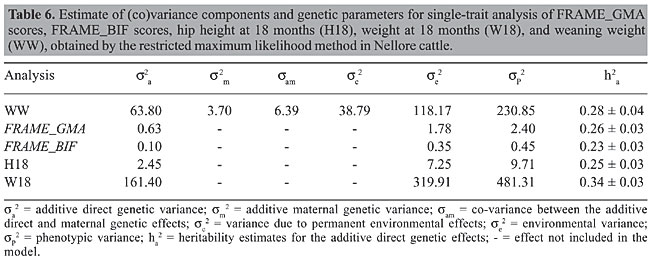
Using the equations recommended by the Beef Improvement Federation (2002), 12,084 FRAME_BIF scores were estimated. The descriptive statistics, by sex, for the FRAME_BIF scores are given in Table 5. Mercadante et al. (2004) reported a lower range for Nellore cattle, of 6.03 ± 0.99 for FRAME_BIF scores for females between 16 and 21 months. The low variability, observed in our study, of the FRAME_BIF scores, based on the variation coefficients for males and females, and the high percentage of scores 6 and 7 was similar to the variation observed by Mercadante et al. (2004). The coefficients of variation observed by gender for FRAME_BIF scores were lower than those observed for FRAME_GMA. The coefficient of variation for W18 was about 72% higher than for H18 and approximately 50% higher than the coefficient for Age18 for both genders (Tables 2 and 3). In the models for estimation of the FRAME_GMA scores, W18 influenced the coefficients of variation of the frame scores, through its greater variability; this did not happen with the FRAME_BIF scores, as these variables had low variability. The estimates of the FRAME_GMA and FRAME_BIF scores were approximated to whole values, considering the difficulty of interpretation of the decimal values for frame, especially under field conditions. This decision was based on the high phenotypic Pearson and Spearman correlation coefficients from 0.93 to 0.99 for males and females, for the frame scores. The estimates of co-variance components and heritability in single-trait analysis are shown in Table 6. In multi-trait analysis, with WW being considered the “anchor trait”, heritability estimates for additive genetic direct effects for FRAME_GMA and FRAME_BIF were 0.28 and 0.24, respectively. The estimated heritabilities for frame scores in multi-trait analysis with W18 presented the same values as were determined with single-trait analysis. The heritability for FRAME_BIF obtained with both single- and multi-trait analysis was lower than the values reported by Mercadante et al. (2004), who examined a data set of 3,948 animals and found 0.48 ± 0.04 and 0.60, respectively.
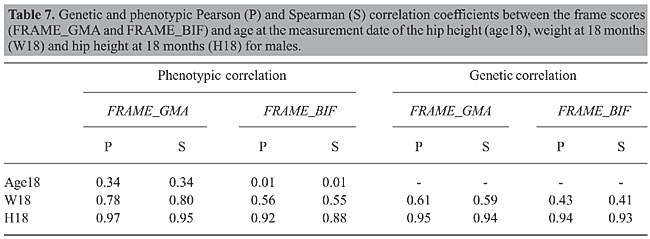
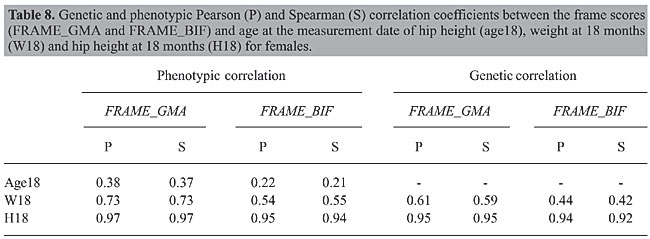
The co-variance estimates between WW and FRAME_GMA (sa1a2 = 4.63) and with FRAME_BIF (sa1a2 = 1.63), obtained with multi-trait analysis, showed that selection for weaning weight should positively affect frame scores. Positive correlations between WW and height (Scarpati et al., 1996) proved that selection for weight at early ages increases beef cattle frame traits. Phenotypic Pearson and Spearman correlation coefficients between the FRAME_GMA and the FRAME_BIF for males were 0.87 and 0.83, respectively, being lower than those found for females (0.92 for both coefficients). The genetic correlation between the frame scores did not differ between genders, with values of 0.92 for the Pearson coefficient and 0.91 for the Spearman coefficient. The high genetic and phenotypic correlations between the frame scores show that the models for estimating FRAME_GMA are well adjusted to the data set, being superior to FRAME_BIF for estimating weight. Horimoto et al. (2004), using 33,567 records of a different Nellore data set, came to similar conclusions. Tables 7 and 8, present Pearson and Spearman phenotypic and genetic correlations between frame scores and traits used in the models for estimating the scores, divided by gender.
The observed estimates of phenotypic correlation between FRAME_GMA and the independent variables, Age18, W18 and H18, were always higher, for both genders, when compared to the phenotypic correlations between FRAME_BIF and these same independent variables. Similar results were reported by Horimoto et al. (2004), in other study with the same breed. The estimates of genetic correlation were also higher between the FRAME_GMA and the independent variables W18 and H18, for males and females, based on the estimates of genetic correlation between FRAME_BIF and these same independent variables. CONCLUSIONS Specific mathematical models that have been developed for estimating frame scores for Nelore cattle have been found to be better adjusted to that breed than the equations recommended by the American Beef Improvement Federation (2002). Our model for estimating frame scores and genetic parameters was developed for and tested on a Nelore cattle population. Further studies will be needed to determine the applicability of this model to other population samples and for other age groups. ACKNOWLEDGMENTS The authors thank the Conselho Nacional de Desenvolvimento Científico e Tecnológico (CNPq), the Coordenadoria de Aperfeiçoamento de Pessoal de Ensino Superior (CAPES) and the Fundação de Amparo à Pesquisa do Estado de São Paulo (FAPESP) for financial support, and Agro-Pecuária CFM Ltda. for supplying data. REFERENCES American Beef Improvement Federation (2002). Uniform guidelines for beef improvement programs. ABIF, Athens. Boldman KG, Kriese LA, Van Vleck LD, Van Tassel CP, et al. (1995). A manual for use of MTDFREML: a set of programs to obtain estimates of variances and covariances. USDA-ARS, Lincoln. Dhuyvetter J (1995). Beef cattle frame scores. North Dakota State University. http://www.ext.nodak.edu/extpubs/ansci/beef/as1091w.htm. Accessed November 4, 2004. Horimoto ARVR (2005). Estimativas de parâmetros genéticos para escores de estrutura corporal (frame) em bovinos de corte da raça Nellore. Master’s thesis, Faculdade de Zootecnia e Engenharia de Alimentos, Universidade de São Paulo, Campus de Pirassununga, Pirassununga, SP, Brazil. http://www.teses.usp.br/teses/disponiveis/74/74131/tde-16062005-084502/. Accessed June 10, 2006. Horimoto ARVR, Balieiro JCC, Ferraz JBS, Figueiredo LGG, et al. (2004). Proposta de modelo para estimação de escores de frame em um rebanho da raça Nellore. In: Simpósio da Sociedade Brasileira de Melhoramento Animal, 5, 2004, Pirassununga. Anais eletrônicos. SBMA, Pirassununga. http://www.sbmaonline.org.br/anais/v/trabalhos/bovinocorte/bc045.pdf. Accessed February 15, 2005. MacNeil MD (1983). Choice of a prediction equation and the use of the selected equation in subsequent experimentation. J. Anim. Sci. 57: 1328-1336. McKiernan B (2005). Frame scoring of beef cattle. http://www.agric.nsw.gov.au/reader/beefappraisal/a234.htm. Accessed November 4, 2004. Mercadante ME, Packer IU, Razook AG, Cyrillo JN, et al. (2003). Direct and correlated responses to selection for yearling weight on reproductive performance of Nellore cows. J. Anim. Sci. 81: 376-384. Mercadante MEZ, Razook AG, Cyrillo JNSG, Figueiredo LA, et al. (2004). Caracterização do tamanho de animais Nellore com base na tabela da Federação Americana de Melhoramento de Gado de Corte (BIF). In: Simpósio da Sociedade Brasileira de Melhoramento Animal, 5, 2004, Pirassununga. Anais eletrônicos. SBMA, Pirassununga. http://www.sbmaonline.org.br/anais/v/trabalhos/bovinocorte/bc007.pdf. Accessed February 15, 2005. SAS (2000). User’s guide. Version 8. SAS Institute Inc., Cary. Scarpati MTV, Magnabosco CU, Josahkian LA, Júnior BCO, et al. (1996). Estudo de medidas corporais e peso vivo em animais jovens da raça Nellore. In: Reunião Anual da Sociedade Brasileira de Zootecnia, 33, Fortaleza. Anais, SBZ, Fortaleza, CD-ROM. Vargas CA, Olson TA, Chase CC Jr, Hammond AC, et al. (1999). Influence of frame size and body condition score on performance of Brahman cattle. J. Anim. Sci. 77: 3140-3149. |
|