![]()
![]()
![]()
![]()
![]()
![]()
![]()
![]()
![]()
![]()
![]()
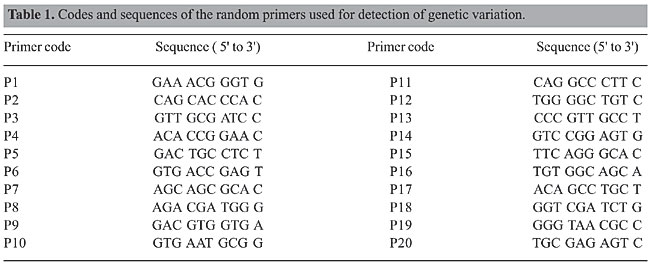
ABSTRACT. Random amplified polymorphic DNA molecular marker was utilized as a means of analyzing genetic variability in seven bat species: Molossus molossus, M. rufus, Eumops glaucinus, E. perotis, Myotis nigricans, Eptesicus furinalis, and Artibeus planirostris. The determination of genetic diversity was based on 741 bands produced by a 20-random primer set. Only eight bands were considered monomorphic to one species. The greatest number of bands and the most polymorphic condition were exhibited by M. molossus, followed by M. nigricans, A. planirostris, E. furinalis, E. glaucinus, M. rufus, and E. perotis. Nei’s genetic diversity index in the seven species considering the 20 primers was not greater than 0.22, but some primers were capable of detecting values between 0.39 and 0.49. Nei’s unbiased genetic distance values and the UPGMA clustering pattern show that M. molossus and M. rufus have a close genetic relationship, unlike that observed between E. perotis and E. glaucinus. The latter was clustered with A. planirostris and E. furinalis. The low values for genetic diversity and distance observed indicate a genetic conservatism in the seven species. The fluorescent in situ hybridization experiments did not confirm a monomorphic condition for the eight bands identified, demonstrating that the monomorphic bands obtained by random amplified polymorphic DNA are insufficient for the identification of bat species. Key words: Chiroptera, Fluorescent in situ hybridization, Random amplified polymorphic DNA, Genetic variation, Bats INTRODUCTION Artibeus (Phyllostomidae), Molossus, Eumops (Molossidae), Myotis, and Eptesicus (Vespertilionidae) are among the most variable genera of Chiroptera. Recognition of the species of these genera is based, in general, on morphological and cranial characteristics. However, such characteristics are of limited value because they reveal considerable intraspecific variation and differences among species are small (Freeman, 1981; Wetterer et al., 2000; López-González and Presley, 2001; Ruedi and Mayer, 2001; Lim et al., 2004; Bickham et al., 2004; Timm and Genoways, 2004). Despite the evident effort to better understand systematic relationships among the diverse species, some issues about systematic relationships as well as problems with identification remain unsolved. In modern studies on the phylogeny and taxonomy on the intraorder level, the molecular analysis role of PCR-based markers has been of great significance. For example, molecular markers have been obtained using the following methods: random amplified polymorphic DNA (RAPD), SSR-PCR, Sine-PCR, and AFLP, as well as others involving amplification and sequencing of nuclear and mitochondrial genes (Wright et al., 1999; Corneli and Ward, 2000; Bannikova et al., 2002; Kawai et al., 2002; Newton et al., 2003; Lim et al., 2004; Callejas et al., 2004; Panaram and Borowsky, 2005). In Chiroptera, new characteristics available as a result of molecular approaches have helped to give new strength to systematic studies as well as to knowledge concerning the evolutionary potential of populations and species (Wright et al., 1999; Ditchfield, 2000; Kawai et al., 2003; Hoofer et al., 2003; Newton et al., 2003; Van Den Bussche and Hoofer, 2004; Dávalos and Jansa, 2004; Porter and Baker, 2004; Ferreira et al., 2005). Despite the fact that most molecular investigations have attempted to characterize mitochondrial DNA sequences, the RAPD method is among the molecular tools that provide most information about some vertebrate species, especially with regard to the assessment of genetic variation within species. The RAPD technique detects randomly amplified polymorphic DNA fragments in PCR with a single arbitrary primer of 8-10 bp (Williams et al., 1990). The number of fragments amplified and the degree of polymorphism in eukaryotic species depend on the nucleotide sequence, the secondary structure and the number of primers used for each RAPD assay. These features of the RAPD assay make it possible to detect DNA polymorphism in the absence of specific nucleotide sequence information. Thus, the RAPD-PCR method has been used successfully to detect genetic variation within and between related species and populations of different organisms, making it possible to conduct molecular phylogenetic studies (Callejas and Ochando, 1998; Mamuris et al., 1999; Prioli et al., 2002; Almeida et al., 2001, 2003; Hassanien et al., 2004). Bats are of particular interest to evolutionary biology since they have a capacity for long-distance dispersal through flight and, indeed, there are differences at the intraspecific level in molecular patterns and genetic variation that could be markedly unlike those of other small mammals that do not fly. In general, high dispersal abilities are associated with a low population structure (Bohonak, 1999), which has been reported for some mobile species, including birds (Avise, 1994), cetaceans (Larsen et al., 1996) and bats (McCracken and Gassel, 1997; Petit and Mayer, 1999; Ditchfield, 2000; Burland and Wilmer, 2001). Studies describing molecular patterns of intraspecific geographical differentiation in bats have indicated a low level of genetic divergence and a limited geographical structure in species with continental distribution (Patterson et al., 1992; Sinclair et al., 1996). However, high-intraspecific divergence levels with clearly defined geographical structuring have also been observed. These different results can be attributed to the different molecular markers used in the various studies. There are very few estimates of genetic variability determined by variable markers such as RAPD. In the present study, therefore, the RAPD procedure was used in order to characterize genetic variability for seven species of bats belonging to five genera (Artibeus planirostris, Molossus molossus, Molossus rufus, Eumops glaucinus, Eumops perotis, Myotis nigricans, and Eptesicus furinalis), and also to identify a species-specific marker which would then be employed as a probe in fluorescent in situ hybridization (FISH) experiments. MATERIAL AND METHODS DNA extraction and random amplified polymorphic DNA analysis The present study analyzed ten specimens belonging to each of six species: Artibeus planirostris, Molossus molossus, Molossus rufus, Eumops glaucinus, Eumops perotis, and Myotis nigricans, and six specimens of Eptesicus furinalis collected in a single locality (São José do Rio Preto 20°48’S, 49°24’W, São Paulo State). Total genomic DNA was isolated from lung and liver tissues according to Sambrook et al. (1989). The specimens analyzed are deposited in the Chiroptera Collection of São Paulo State University (UNESP) at São José do Rio Preto, Brazil. A set of 20 random decanucleotide primers (Invitrogen do Brasil) that produced accurate bands (Table 1) was used in the detection of polymorphism among populations. Amplification conditions were according to Williams et al. (1990) with some modifications. The reactions were performed in a total volume of 15 µL containing 25 ng genomic DNA, 1.5 mM MgCl2, 200 µM of each dNTP, 50 pmol of a single 10-base primer, 0.5 µg/mL BSA, and 1 U Taq DNA-polymerase. PCR was performed in a thermocycler (Perkin Elmer 2400) programmed at 94°C for 3 min, followed by 43 cycles of 30 s at 94°C, 1 min at 35°C and 2 min at 72°C. After the last cycle, there was a 5-min extension at 72°C.
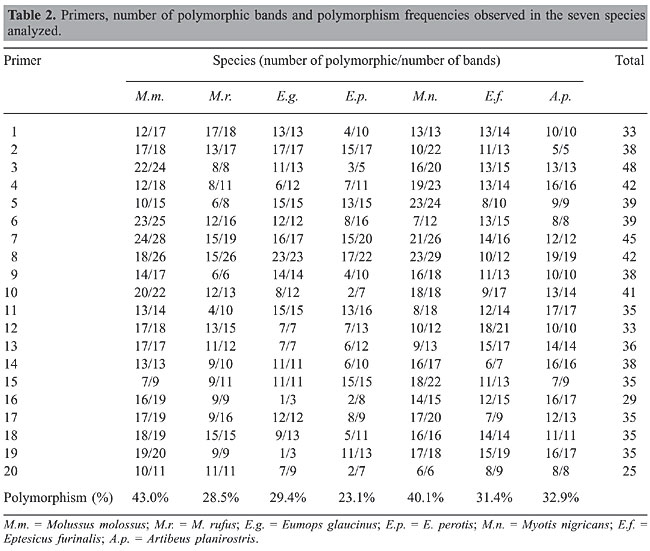
RAPD-PCR technical limitations were resolved following a strict protocol with standardized conditions, repeating the amplification reactions two or more times. The RAPD products were resolved by vertical electrophoresis on 8% polyacrylamide gels, run with 1X TBE buffer (Tris, boric acid, 0.5 M EDTA, pH 8.0) and subsequently stained with silver nitrate. Bands occurring only in the ten specimens of a particular species were recognized as monomorphic (species-specific) and excised from polyacrylamide gels, reamplified in the presence of biotinylated nucleotide (14-dATP; Gibco), and the DNA used as a probe in FISH. Data analysis RAPD patterns of specimens were determined by direct comparison of the amplified DNA electrophoresis profiles. Fragments were scored as 1 if present or 0 if absent, based on a molecular size standard marker, and the data obtained were analyzed as binary variables. Each band was considered to be an allele of a locus. The number and frequencies of polymorphic loci, gene diversity indices and unbiased genetic distances were estimated according to Nei (1978) using POPGENE 1.31 software (Yeh and Boyle, 1997). Clustering was performed by the unweighted pair-group method of analysis (UPGMA) with statistical support obtained by bootstrapping with 1000 interactions (PAUP, Version 4.0; Swofford, 2002). Fluorescent in situ hybridization FISH was performed to verify the specificity of species-specific bands. The probes consisting of the biotinylated monomorphic fragments were applied onto the interphasic nucleus of specimens of the band-carrying species and other species analyzed. Cellular suspensions were obtained from primary fibroblast cultures according to Morielle-Versute and Varella-Garcia (1995). Dividing cells were prepared following mitotic arrest with colchicine (4 x 10⁻⁴ mol/L) for 30 min, hypotonic treatment (10% sodium citrate) for 30 min, and fixation in 3:1 methanol:acetic acid (v/v). Prior FISH slides were pretreated with RNase (0.1 mg/mL) and pepsin (0.008%) and denatured in 70% formamide/2X SSC, pH 7.0, at 72°C for 2-3 min. The probe consisting of 1 µg of the biotinylated fragments combined with 50 µg salmon sperm DNA and 25 µg mouse Cot-1 DNA, was denatured in a water bath at 72°C for 5 min, quickly chilled on ice, centrifuged for 2 s and applied to selected areas of the slide (27 mL/slide on 22 x 50-mm coverslips). Hybridization was performed for 16 h at 37°C in a humidified chamber. Slides were washed three times, for 5 min each time, in 50% formamide/2X SSC and in 2X SSC at 37°C. Finally, they were washed twice in 4X SSC, 0.05% v/v Tween 20, pH 7.0, at room temperature. Detection was performed with fluorescein-isothiocyanate conjugated to avidin. Cells were counterstained with propidium iodide in fluorescence antifade solution (0.3 mg/mL). Analysis was performed in a Zeiss Axiophot fluorescence microscope with interference filter sets for fluorescein-isothiocyanate and Texas-red. RESULTS AND DISCUSSION Banding polymorphism patterns Using RAPD-PCR in order to analyze intra- and interspecific genomic polymorphism in Chiroptera, it was possible to obtain a significantly greater number of amplified fragments. The 20 primers examined produced a total of 741 scorable bands (Table 2). On overage, 25 to 48 RAPD fragments with a length of 200 to 1000 bp were detected. The number of bands was variable in each species. M. molossus was the species that produced the greatest number of bands (369), and E. glaucinus the lowest (239). The number of polymorphic bands and the relative and average frequencies also varied.
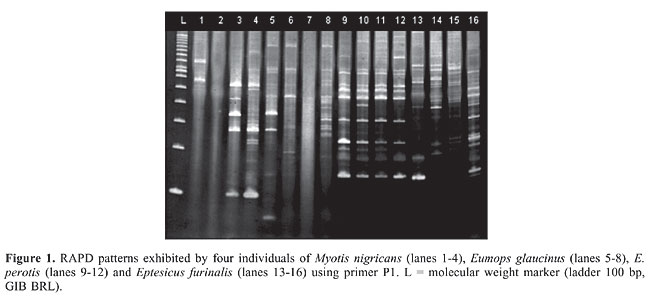
The most polymorphic species was M. molossus (43%), followed by M. nigricans (40.1%), A. planirostris (32.9%), E. furinalis (31.4%), E. glaucinus (29.4%), M. rufus (28.5%), and E. perotis (23.1%). The observed DNA polymorphism did not only consist of the presence or absence of fragments with a particular length in the RAPD patterns, but also of a change in the intensity of amplification of fragments with the same length (Figure 1). Only eight (1.1%) bands were monomorphic for one of the seven species: four in M. nigricans (P7 - 130 bp, P6 - 150 bp, P11 - 226 bp, and P2 - 275 bp), two in M. molossus (P4 - 485 bp and P6 - 133 bp), one in E. glaucinus (P4 - 231 bp), and one in E. furinalis (P7 - 110 bp). These fragments were isolated, reamplified and utilized as a probe in FISH analysis.
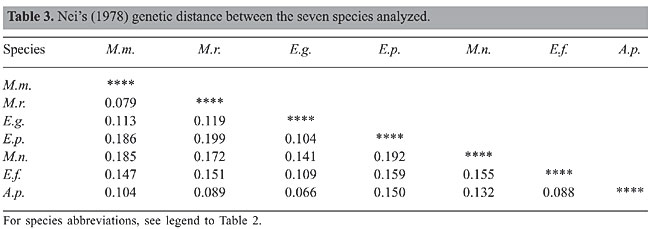
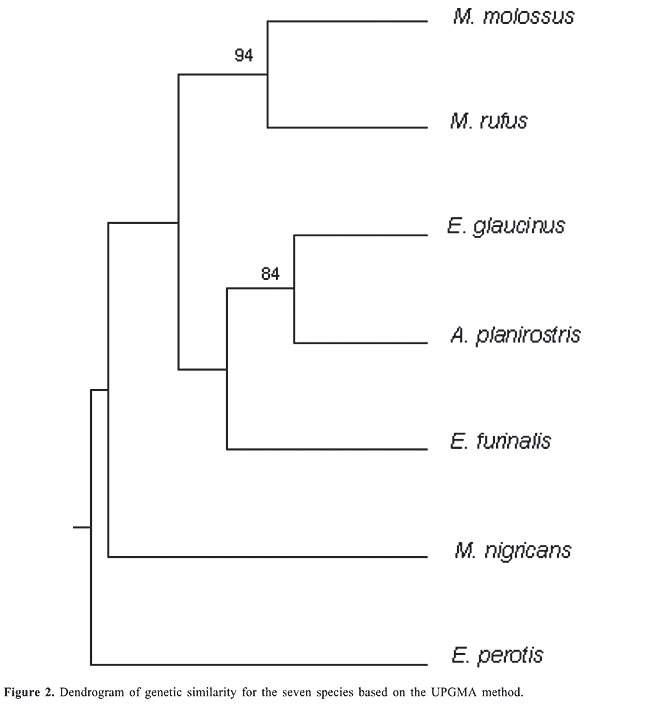
The results observed show that the RAPD-PCR assay is capable of revealing polymorphism in species of bats. All 20 random decanucleotide primers produced at least one polymorphic fragment. Some authors have pointed out that, although RAPD-PCR is a powerful technique for detecting random amplified polymorphic DNA and several reasons exist for the amplification of DNA regions, the main shortcoming of this technique is its sensitivity to changes in reaction conditions, where the use of markers often results in imperfect estimation of genetic distances between taxa of supraspecies rank (Rothuizen and Van Wolferen, 1994). In our experiments the results obtained by optimized and repeatable conditions made differences in banding patterns an improbable RAPD artifact. Gene diversity and genetic distance The 741 polymorphic bands were taken as RAPD markers and combined in a simple matrix of binary data, with scores for the presence or absence of bands. The Nei gene diversity index within each species was not greater than 0.22, which was observed in M. molossus specimens. For the total specimens (66), the index was 0.36. Despite these low values for gene diversity, some primers were capable of detecting values between 0.39 and 0.49 (primers 2, 7, 16, and 8). Estimates of Nei’s unbiased genetic distances between the seven species, and the UPGMA clustering pattern are shown in Table 3 and Figure 2. The distances were low. The highest genetic distance was observed between populations of E. perotis and M. rufus (0.199) and the lowest between E. glaucinus and A. planirostris (0.066). The UPGMA dendrogram shows that only the taxa of Molossus were clustered together, indicating the close genetic relationship among Molossus species. Despite the taxonomic proximity between E. glaucinus and E. perotis, they were not clustered together. E. glaucinus was clustered with A. planirostris and E. furinalis.
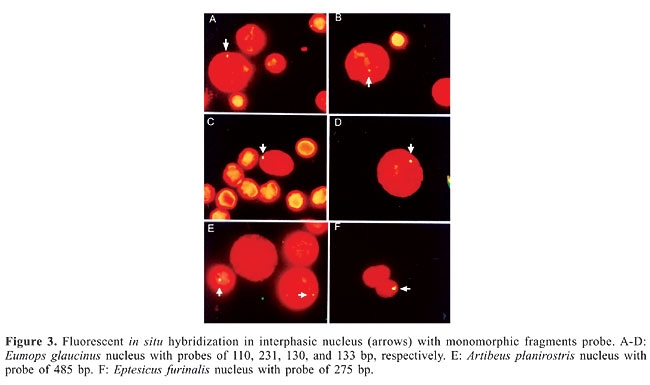
The low RAPD divergence between individuals and species, as derived from the Nei estimate and the UPGMA tree, indicated that the seven species of bats studied show conservatism in RAPD fragment sequences, reinforcing the high genetic similarity estimated by inter- and intraspecific mitochondrial DNA variation, with average sequence divergence usually between 1 and 2.5% (Ditchfield, 2000). However, the genetic variability detected by RAPD demonstrated that there are differences in genetic structure between congeneric species, species of the same family and species of different families. Although much still remains to be understood, RAPD-PCR alleles have been considered to derive from repetitive regions of the genome (Haymer, 1994), and are thus assumed to be neutral markers. Intra- and interspecific genetic differentiation can be driven by ecological, evolutionary and historical factors, and the knowledge of the effects of genetic variability in species of bats is important for an understanding of how diversity is distributed among populations and species of volant mammals (Miller-Butterworth et al., 2003). The differences between related bat species have been interpreted as indicating different dispersal capabilities and different levels of gene flow, a scenario that is congruent with documented differences in wing morphology, colony size and number of subspecies (Newton et al., 2003). It has been pointed out that, although many bat populations show near-panmixia, there is always some degree of population structure due to features of their mating systems or philopatry (Rivers et al., 2005), seen particularly in populations of vespertilionid bats (Myotis nattereri and M. bechsteinii), which demonstrate an autumn “swarming,” a seasonal event that involves the visitation of large numbers of individuals of temperate bat species to underground sites prior to hibernation. In these populations, the peculiar genetic feature is high gene diversity caused by mating at autumn swarming sites, allowing interbreeding between bats from otherwise isolated summer colonies (Parsons et al., 2002; Kerth et al., 2003; Veith et al., 2004; Rivers et al., 2005). Miller-Butterworth et al. (2003) argue that examining patterns of inter-population genetic diversity in bats can provide valuable information about historical and current evolutionary processes affecting a species. The authors found that genetic structure correlates with local biomes and differentiation in wing morphology, indicating that bats may adapt to local environmental conditions surrounding their roosts. Despite the morphological variation among species, the differences in polymorphism frequencies and genetic distances observed among the species analyzed in the present study can be interpreted in the same sense. The similarities observed between congeneric and non-congeneric species may be a reflection of adaptation to local biome, occurring in the evolutionary process affecting a species. Fluorescent in situ hybridization with random amplified polymorphic DNA products Each of the fragments identified as species-specific DNA sequences (monomorphic) was expected to hybridize with a genome region of that species where it was identified. Despite the monomorphic condition, when the fragments were used as probes in the FISH procedures, they hybridized with nuclear DNA of different species, and did not confirm band specificity. Only one fragment (P4 - 231 bp) was observed hybridized to the nucleus of the species that produced it (E. glaucinus) and one of its congeneric species (E. perotis). The other seven fragments hybridized with the nucleus of different species (Figure 3).
One of the critical steps in RAPD analysis is to identify the desired DNA from among contaminating sequences of similar length. Studies involving molecular characterization of the polymorphic fragments have demonstrated that amplified bands often contain more than one sequence arising from technical error, DNA of commensal organisms and fragment rearrangements during PCR amplification (Gu et al., 1999; Rabouam et al., 1999). Despite the use in the present study of polyacrylamide gels, the matrix that produces the highest band resolution level, the results presented here reinforce previous observations that, due to the non-specific nature of RAPD, a single primer can produce similar size amplification products from various regions of the genome, which may not be resolved on 2% agarose gels, commonly used for the analysis of RAPD-PCR. FISH is a sensitive method for the identification of homologies of specific DNA sequences with cell genome and chromosomes (Bentivegna et al., 2001). In bats, FISH analysis demonstrated that monomorphic bands obtained by RAPD are not sufficient to identify species. Thus, our results may not be generally applicable to the use of RAPD for the identification of species. However, they show that the use of FISH in RAPD studies may be suitable as a complementary technique in analyses of vertebrate groups where the RAPD-PCR technique alone had been employed for the purpose of species identification. ACKNOWLEDGMENTS The authors wish to thank the Brazilian agencies FAPESP (Fundação de Amparo à Pesquisa do Estado de São Paulo, Grant No. 00/06726-3) and CAPES (Coordenadoria de Aperfeiçoamento de Pessoal de Ensino Superior) for providing financial support for this investigation and Dr. Peter James Harris for criticism and suggestions regarding the English of the manuscript. REFERENCES Almeida FS, Fungaro MHP and Sodré LMK (2001). RAPD and isoenzyme analysis of genetic variability in three allied species of catfish (Siluriformes: Pimelodidae) from the Tibagi River, Brazil. J. Zool. 253: 113-120. Almeida FS, Sodré LMK and Contel EPB (2003). Population structure analysis of Pimelodus maculates (Pisces, Siluriformes) from the Tietê and Paranapanema Rivers (Brazil). Genet. Mol. Biol. 26: 301-305. Avise JC (1994). Molecular markers, natural history and evolution. Chapman and Hall Ltd., New York. Bannikova AA, Matveev VA and Kramerov DA (2002). Using Inter-Sine-PCR to study mammalian phylogeny. Russ. J. Genet. 38: 714-724. Bentivegna A, Venturin M, Gervasini C, Corrado L, et al. (2001). FISH with locus-specific probes on stretched chromosomes: a useful tool for genome organization studies. Chromosome Res. 9: 167-170. Bickham JW, Patton JC, Schlitter DA, Rautenbach IL, et al. (2004). Molecular phylogenetics, karyotypic diversity, and partition of the genus Myotis (Chiroptera: Vespertilionidae). Mol. Phylogenet. Evol. 33: 333-338. Bohonak AJ (1999). Dispersal, gene flow, and population structure. Q. Rev. Biol. 74: 21-45. Burland TM and Wilmer JW (2001). Seeing in the dark: molecular approaches to the study of bat populations. Biol. Rev. Camb. Philos. Soc. 76: 389-409. Callejas C and Ochando MD (1998). Identification of Spanish barbel species using the RAPD technique. J. Fish Biol. 53: 208-215. Callejas C, Lusková V and Ochando MD (2004). A contribution to the genetic characterization of some species of the genus Gobio (Cyprinidae). Folia Zool. 53: 433-436. Corneli PS and Ward RH (2000). Mitochondrial genes and mammalian phylogenies: increasing the reliability of branch length estimation. Mol. Biol. Evol. 17: 224-234. Dávalos LM and Jansa SA (2004). Phylogeny of the Lonchophyllini (Chiroptera: Phyllostomidae). J. Mamm. 85: 404-413. Ditchfield AD (2000). The comparative phylogeography of Neotropical mammals: patterns of intraspecific mitochondrial DNA variation among bats contrasted to nonvolant small mammals. Mol. Ecol. 9: 1307-1318. Ferreira JM, Martins FM, Ditchfield A and Morgante JS (2005). The use of PCR-RFLP as an identification tool for two closely related species of bats of genus Plathyrrhinus. Genet. Mol. Biol. 28: 120-122. Freeman PW (1981). A multivariate study of the family Molossidae (Mammalia, Chiroptera): morphology, ecology, evolution. Fieldiana Zool. 7: 1-173. Gu W, Post CM, Aguirre GD and Ray K (1999). Individual DNA bands obtained by RAPD analysis of canine genomic DNA often contain multiple DNA sequences. J. Hered. 90: 96-98. Haymer DS (1994). Randon amplified polymorphic DNAs and microsatellites: what are they, and can they tell us anything we don’t really know? Ann. Entomol. Soc. Am. 87: 717-722. Hassanien HA, Elnady M, Obeida A and Itriby A (2004). Genetic diversity of Nile tilapia populations revealed by randomly amplified polymorphic DNA. Aquacult. Res. 35: 587-593. Hoofer SR, Reeder SA, Hansen EW and Bussche RVD (2003). Molecular phylogenetics and taxonomic review of noctilionid and vespertilionid bats (Chiroptera: Yangochiroptera). J. Mamm. 84: 809-821. Kawai K, Nikaido M, Harada M, Matsumura S, et al. (2002). Intra- and interfamily relationships of Vespertilionidae inferred by various molecular markers including SINE insertion data. J. Mol. Evol. 55: 284-301. Kawai K, Nikaido M, Harada M, Matsumura S, et al. (2003). The status of the Japanese and East Asian bats of the genus Myotis (Vespertilionidae) based on mitochondrial sequences. Mol. Phylogenet. Evol. 28: 297-307. Kerth G, Kiefer A, Trappman C and Weishaar M (2003). High gene diversity at swarming sites suggest hot spots for gene flow in the endangered Bechstein´s bat. Conserv. Genet. 4: 491-499. Larsen AH, Sigurjonsson J, Oien N, Vikingsson G, et al. (1996). Populations genetic analysis of nuclear and mitochondrial loci in skin biopsies collected from central and northeastern North Atlantic humpback whales (Megaptera novaeangliae): population identity and migratory destinations. Proc. Biol. Sci. 263: 1611-1618. Lim BJ, Engstrom MD, Lee TE, Patton JC, et al. (2004). Molecular differentiation of large species of fruit-eating bats (Artibeus) and phylogenetic relationships based on the cytochrome b gene. Acta Chiropterol. 6: 1-12. López-González C and Presley SJ (2001). Taxonomic status of Molossus bondae J.A. Allen, 1904 (Chiroptera: Molossidae), with description of a new subspecies. J. Mamm. 82: 760-774. Mamuris Z, Bani M, Stamtis C and Triantaphyllidisullis C (1999). Taxonomic relationships between four species of the Mullidae family revealed by three genetic methods: allozymes, random amplified polymorphic DNA and mitochondrial DNA. J. Fish Biol. 55: 572-587. McCracken GF and Gassel MF (1997). Genetic structure in migratory and nonmigratory populations of Brazilian free-tailed bats. J. Mamm. 78: 348-357. Miller-Butterworth CM, Jacobs DS and Harley EH (2003). Strong population substructure is correlated with morphology and ecology in a migratory bat. Nature 424: 187-191. Morielle-Versute E and Varella-Garcia M (1995). A simple and fast procedure to grow bat fibroblasts from lung biopsies for cytogenetic studies. Braz. J. Genet. 18: 503-505. Nei M (1978). Estimation of average heterozygosity and genetic distance from a small number of individuals. Genetics 89: 583-590. Newton LR, Nassar JM and Fleming TH (2003). Genetic population structure and mobility of two nectar-feeding bats from Venezuelan deserts: inferences from mitochondrial DNA. Mol. Ecol. 12: 3191-3198. Panaram K and Borowsky R (2005). Gene flow and genetic variability in cave and surface populations of the Mexican Tetra Astyanax mexicanus (Teleostei: Characidae). Copeia 2: 409-416. Parsons KN, Jones G, Davidson-Watts I and Greenaway F (2002). Swarming of bats at underground sites in Britain - implications for conservation. Biol. Conserv. 111: 63-70. Patterson BD, Pacheco V and Ashley MV (1992). On the origins of western slope endemism: systematics of fig-eating bats, genus Artibeus. Mem. Mus. Hist. Nat. UNMSM 2: 189-205. Petit E and Mayer F (1999). Male dispersal in the noctule bat (Nyctalus noctula): where are the limits? Proc. Biol. Sci. 266: 1717-1722. Porter CA and Baker RJ (2004). Systematics of Vampyressa and related genera of Phyllostomidae bats as determined by cytochrome-B sequences. J. Mamm. 85: 126-132. Prioli SMAP, Prioli AJ, Júlio HF Jr, Pavanelli CS, et al. (2002). Identification of Astyanax altiparanae (Teleostei, Characidae) in the Iguaçu River, Brazil, based on mitochondrial DNA and RAPD markers. Genet. Mol. Biol. 25: 421-430. Rabouam C, Comes AM, Bretagnolle V, Humbert JF, et al. (1999). Features of DNA fragments obtained by random amplified polymorphic DNA (RAPD) assays. Mol. Ecol. 8: 493-503. Rivers NM, Butlin RK and Altringham JD (2005). Genetic population structure of Natterer’s bats explained by mating at swarming sites and philopatry. Mol. Ecol. 14: 4299-4312. Rothuizen J and Van Wolferen M (1994). Randomly amplified DNA polymorphisms in dogs are reproducible and display Mendelian transmission. Anim. Genet. 25: 13-18. Ruedi M and Mayer F (2001). Molecular systematics of bats of the genus Myotis (Vespertilionidae) suggests deterministic ecomorphological convergences. Mol. Phylogenet. Evol. 21: 436-448. Sambrook J, Fritsh EF and Maniatis T (1989). Molecular cloning: a laboratory manual. Cold Spring Harbor Laboratory, Cold Spring Harbor. Sinclair EA, Webb N, Marchant AD and Tideman CR (1996). Genetic variation in the little red flying-fox Pteropus scapulatus (Chiroptera: Pteropodidae): implication for management. Biol. Conserv. 74: 45-50. Swofford DL (2002). PAUP*: Phylogenetic analysis using parsimony (*and other methods). Version 4. Software. Sinauer Associates Inc., Sunderland. Timm RM and Genoways HH (2004). The Florida bonneted bat, Eumops floridanus (Chiroptera: Molossidae): distribution, morphometrics, systematics, and ecology. J. Mamm. 85: 852-865. Van Den Bussche RA and Hoofer SR (2004). Phylogenetic relationships among recent chiropteran families and the importance of choosing appropriate outgroup taxa. J. Mamm. 85: 321-330. Veith M, Beer N, Kiefer A, Johannesen J, et al. (2004). The role of swarming sites for maintaining gene flow in the brown long-eared bat (Plecotus auritus). Heredity 93: 342-349. Wetterer AL, Rockman MV and Simmons NB (2000). Phylogeny of Phyllostomid bats (Mammalia: Chiroptera): data from diverse morphological systems, sex chromosomes, and restriction sites. Bull. Am. Mus. Nat. Hist. 248: 1-200. Williams JG, Kubelik AR, Livak KJ, Rafalski JA, et al. (1990). DNA polymorphisms amplified by arbitrary primers are useful as genetic markers. Nucleic Acids Res. 18: 6531-6535. Wright AJ, Bussche RVD, Lim BK, Engstrom MD, et al. (1999). Systematics of the genera Carollia and Rhinophylla based on the cytochrome-B gene. J. Mamm. 80: 1201-1213. Yeh FC and Boyle TJB (1997). Population genetic analysis of co-dominant and dominant markers and quantitative traits. Belg. J. Bot. 129: 157. |
|