![]()
![]()
![]()
![]()
![]()
![]()
![]()
![]()
![]()
![]()
![]()
ABSTRACT. Statistical modeling of links between genetic profiles with environmental and clinical data to aid in medical diagnosis is a challenge. Here, we present a computational approach for rapidly selecting important clinical data to assist in medical decisions based on personalized genetic profiles. What could take hours or days of computing is available on-the-fly, making this strategy feasible to implement as a routine without demanding great computing power. The key to rapidly obtaining an optimal/nearly optimal mathematical function that can evaluate the “disease stage” by combining information of genetic profiles with personal clinical data is done by querying a precomputed solution database. The database is previously generated by a new hybrid feature selection method that makes use of support vector machines, recursive feature elimination and random sub-space search. Here, to evaluate the method, data from polymorphisms in the renin-angiotensin-aldosterone system genes together with clinical data were obtained from patients with hypertension and control subjects. The disease “risk” was determined by classifying the patients’ data with a support vector machine model based on the optimized feature; then measuring the Euclidean distance to the hyperplane decision function. Our results showed the association of renin-angiotensin-aldosterone system gene haplotypes with hypertension. The association of polymorphism patterns with different ethnic groups was also tracked by the feature selection process. A demonstration of this method is also available online on the project’s web site. Key words: Genetic polymorphisms, Essential hypertension, Evironmental risks, Support vector machines, Feature selection INTRODUCTION Understanding links between genetic profiles with environmental/clinical data in pathogenesis, follow-up or diagnosis is a challenge. Population heterogeneity and genetic and innumerous external factors all hold information with potential aid for medical decisions. A computational approach able to select important medical features for an individual genetic profile is a path for personalized diagnosis and treatment. The search for these combination patterns can quickly become computationally unfeasible depending on the number of parameters to inquire. Classical feature selection approaches can rapidly find a good solution, but it is not guaranteed to be the best, nor possess a good generalization performance. Here we present a method for rapidly obtaining an optimal/nearly optimal mathematical function that can evaluate the “disease stage” by combining information about genetic profiles with personal clinical data. The former queries a database of pre-computed optimal feature sets that best apply to a specific genetic profile. The database is previously generated by a new hybrid feature selection method that makes use of support vector machines (SVM), recursive feature elimination (RFE) and random sub-space search (RSS). Thus, this approach could assist doctors during medical routine without needing great computing power, offering immediate access to optimized cached solutions. What could take hours or days of computing time, thanks to this approach, is made available on-the-fly. Here, we exemplify this methodology by using hypertension as a study model. We search for diagnosis patterns linking polymorphisms in renin-angiotensin-aldosterone system (RAAS) genes with clinical data. A demonstration program for personalized diagnosis is available online (“Diagnostic SVM”) taking advantage of the constructed database to promptly execute personalized diagnosis. Such a program is also an efficient tool to show trends in the dataset. Hypertension and the renin-angiotensin-aldosterone system In the last decade, the RAAS has received increasing attention in the field of cardiovascular diseases because of its relation to blood pressure maintenance and salt homeostasis. Polymorphisms in RAAS genes have already been associated with angiotensinogen concentration in plasma (Inoue et al., 1997; Ishigami et al., 1997; Jeunemaitre et al., 1997), cardiovascular diseases (Lindpaintner et al., 1995; Pontremoli et al., 2000; Alvarez et al., 2001), blood pressure regulation (Baudin, 2002), vascular stiffness, and increased risk of pregnancy-induced hypertension development (Benetos et al., 1995), amongst others. Having genetic predisposition to a certain disease does not mean that one will eventually have it; its pathogenesis is believed to be the result of a number of complex factors, including ethnic background and, external and clinical factors combined with genetic predisposition. In the present study, information on six RAAS polymorphic genes is studied together with patient clinical data to further verify the combinatory effect of RAAS polymorphisms in essential hypertension. This is primarily achieved by generating a database of feature subsets having optimal solutions for a given classifier and training set. The feature subsets are characterized by a new hybrid machine learning method that combines SVM/RFE and RSS. RAAS polymorphic genes are listed below:
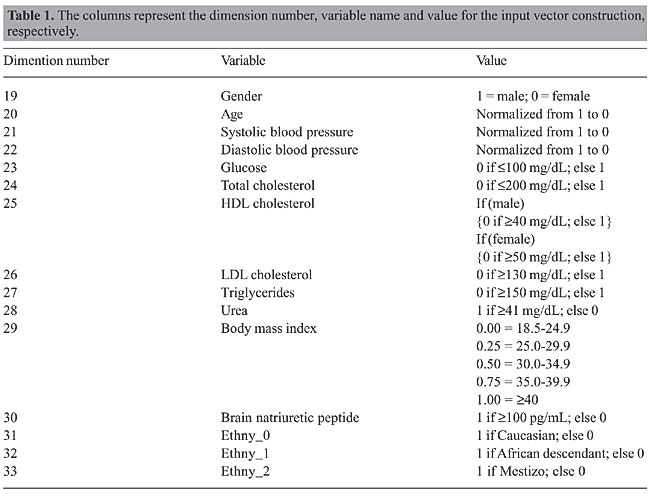
Support vector machines SVM is a supervised learning method based on statistical learning theory and the principle of structural risk minimization, developed by Vapnik (1995). This method has been successfully used in a number of applications ranging from particle and face identification, text categorization, data base marketing, and extensively in bioinformatics. An SVM model is evaluated using the most informative patterns in the data (the support vectors) and is capable of separating classes by finding an optimal hyperplane of maximum margin between both datasets. For cases when data are not linearly separable, the use of a kernel-induced feature space can be applied so data can be mapped to a higher dimension space and then classified by a hyperplane or a linear discriminate function (Boser et al., 1992). Feature selection A feature selection is executed on a dataset to choose reduced subsets that best perform under a determined classification system and also reduce the pattern recognition cost. Various feature selection methods are described in the literature; among them are the genetic algorithms with decision trees (Shah and Kusiak, 2004), beam search, branch-and-bound, Pearson correlation coefficients, Fisher criterion scores, floating search, and recently RFE with SVM. According to Cover and Van Campenhout (1977), no non-exhaustive sequential feature selection procedure is guaranteed to produce the optimal subset, nor does any ordering of the error probabilities. Since the number of subset possibilities grows exponentially with the amount of features, exhaustive searching quickly becomes unfeasible, even for a moderate number of features. Bearing this in mind, a hybrid sub-optimal feature selection method was applied to the hypertension dataset and its performance compared to SVM RFE and RSS. MATERIAL AND METHODS Hypertension evaluation of the study population and RAAS genotyping A total of 91 hypertensive patients from the Hypertension Division of the National Institute of Cardiology Laranjeiras (Rio de Janeiro, RJ, Brazil) and 32 normotensive control subjects were genetically investigated for RAAS gene polymorphisms at the Fiocruz Genetics Department. Blood pressure was determined using a conventional mercury sphygmomanometer on the left arm in the sitting position on three different occasions, by the same observer. Hypertension was defined as subjects with a systolic blood pressure ³140 mmHg or diastolic blood pressure ³90 mmHg. The possibility of secondary hypertension was excluded after complete clinical, laboratorial and radiological investigation. The normotensive group was characterized by the absence of family history of hypertension, renal insufficiency, hepatic disease, or apparent coronary artery disease and a blood pressure <140/90 mmHg. All participants were submitted to complete physical and routine biochemical analyses. Genomic DNA from patients and controls was extracted by a standard salting out method. Polymerase chain reaction and restriction fragment length polymorphism were used to detect AGT M235T, ACE I/D (Nalogowska-Glosnicka et al., 2000), AGTR1 A1166C (Nalogowska-Glosnicka et al., 2000), CYP11B2 C344T (Stella et al., 2004), MR A4582C and MR G3514C polymorphisms according to published procedures. Assay quality control was performed by randomly selecting samples to be genotyped again. This study was approved by the Institutional Ethics Review Board from Fiocruz, and the participants provided written informed consent. Input vector construction for support vector machine modeling The input vector can have a total of 33 dimensions. The input vectors were constructed having each vector representing a subject. Dimensions 1-18 are AGT0, AGT1, AGT2, ACE0, ACE1, ACE2, AGTR0, AGTR1, AGTR2, CYP11B2_0, CYP11B2_1, CYP11P2_2, MRA0, MRA1, MRA2, MRG0, MRG1, and MRG2. The number ending each variable indicates whether 0, 1 or 2 risk alleles are present in the gene. Their values were “1” if present in the genome, otherwise “0”. The remaining dimensions are indicated in Table 1.
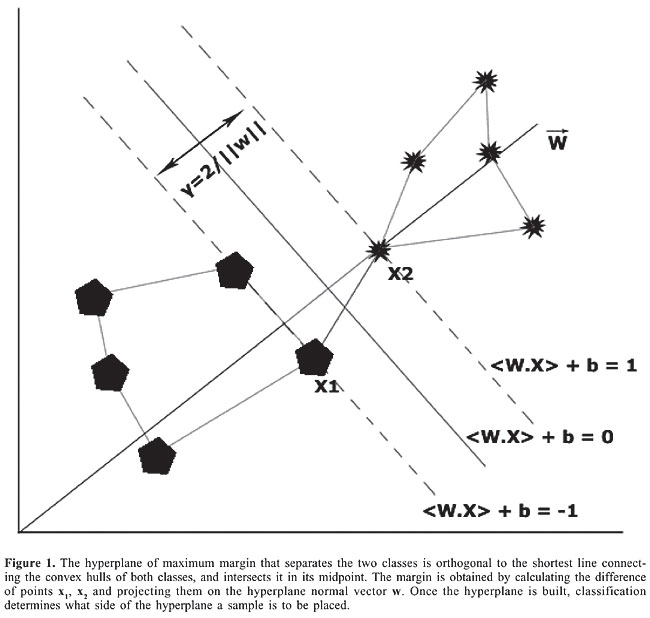
Support vector machine analysis The SVM approach is described as follows. Given a linearly separable training sample: S = ((x1, y1), … (xn, yn)) that produces the equation of a linear classifier: áwt,xñ + b, where w is the normal vector, and b the bias of the hyperplane of maximum margin separating both classes, an unknown sample or input vector x is classified as +1 if: áwt,xñ + b ³ 0, and classified as -1 if: áwt,xñ + b < 0 as seen in Figure 1.
The primal formulation (Boser et al., 1992) consists in minimizing the Euclidean norm of the vector w subject to the classification constraints:
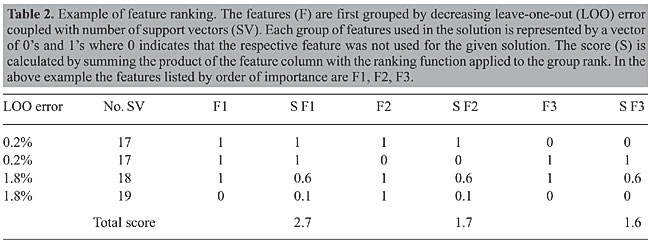
The algorithm searches the space of w’s and b’s to find the widest margin to place a hyperplane. A straight forward approach is reducing it to a convex optimization problem by minimizing a quadratic function under linear inequality constraints. SVM has become a standard in statistical modeling, and further details are thus beyond the scope of this manuscript and can be easily found in the literature (Vapnik, 1995). SVM analysis was carried out using the SVMlight (Joachims, 1998) libraries programmed in C, interfacing with scripts programmed in Perl 5.8 using the linear kernel and a cost parameter of 100 to ensure numerical stability. To compensate for having more hypertensive than normotensive subjects in the dataset, two methods were considered: the first by applying a cost factor where training errors on the positive samples (normotensive) outweigh errors on the negative samples (Joachims, 2002); the second by using flexible margins with different control parameters. Model evaluation The leave-one-out (LOO) approach, also known as jackknife, is performed by excluding one feature vector from the subjects pool, and using the remaining as a training set. The algorithm builds a support vector model based on the training set and then tries to properly classify the excluded feature vector by establishing what side of the hyperplane it is to be placed. The process is repeated until all feature vectors from the pool have gone through this process (Joachims, 2000). Feature selection and ranking Support vector machine - recursive feature elimination Given the training sample S, a SVM model is built and the weight vector w of dimension length d is calculated as described above. The feature k having the smallest ranking criteria where k = arg mini {(wi)2} has the least influence in the hyperplane solution and is eliminated. The remaining set of top ranked features should be taken into account as a group, so that a new SVM model is built in a dimension space d-1. This process is repeated until a desired dimension is obtained. Since features are removed one at the time, an importance ranking can also be established (Guyon et al., 2002). Random sub-space search A script written in Perl 5.8.6 that later interfaced with SVMlight generated 230,000 random feature combinations originating from the initial set of 33 features. For each combination in the list, SVM LOO error, number of support vectors contained in the model, and the tested combination were stored in an MySQL database. Computing random sub-space search scores One of the methods used to rank the features by order of importance was by querying the RSS database to retrieve results having LOO error £2% ordered by LOO error and then by number of support vectors and grouped according to these variables. A quadratic group ranking function having the ordinate value decrease from 1 to 0.1 while its abscissa value ranges from 1 to the number of groups retrieved was used to score the features. An example of this ranking method is shown in Table 2.
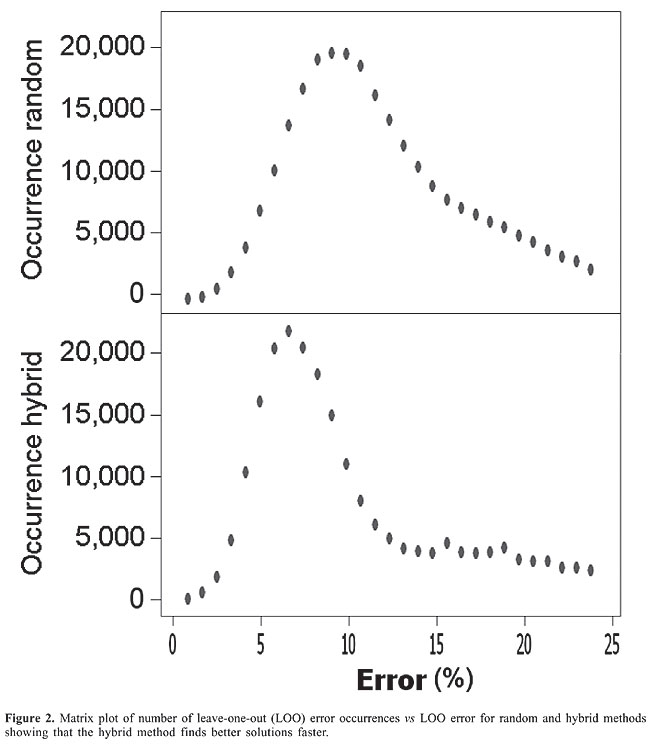
Hybrid recursive feature elimination-random sub-space feature scripts RFE is initially applied to reduce the feature numbers from 33 to 20. Then, RSS performed a semi-exhaustive search generating 230,000 feature set combinations. This method is referred to as hybrid. Online demonstration of the method and script/data availability An online version of the software called “Diagnostic SVM” is available at http://www.dbbm.fiocruz.br/labwim/bioinfoteam/ by clicking on the software tab. The hybrid recursive feature elimination - random sub-space feature scripts and data used for this study are available upon request. Given a genetic profile, “Diagnostic SVM” queries the MySQL feature solution database to obtain the optimal feature set to the given profile. The optimal feature set is considered to be the one having a best match with the individual’s genetic profile, a low LOO error, and a reduced number of support vectors. Clinical data are then entered and a new SVM training is performed to predict whether the input data belong to a hypertensive or normotensive subject. By no means should “Diagnostic SVM” substitute for normal diagnostic procedures; it is currently a simplified model to further study SVM and combinatory effects of RAAS with clinical data in hypertension. Note: All analyses were carried out on a Pentium IV with 256 MB of RAM and a 2.0 GHz clock frequency. RESULTS Feature selection and ranking Genetic and clinical data of 91 hypertensive patients and 31 control subjects were analyzed in order to find correlations with diagnostic value. An initial SVM analysis was able to classify with a 13.11% LOO error among subjects when using the complete (33) feature set, making it evident that further refinements in the methodology are needed. The RSS was able to identify subsets having 1 perfect solution, 4 solutions with a 0.82% LOO error, 153 solutions with a 1.64% LOO error, and 703 solutions with a 2.46% LOO error. The majority of solutions (17,436) had a 9.02% LOO error. The hybrid search narrowed the number of features to 20 using RFE and then searched for solutions using the RSS. The hybrid approach identified subsets having 1 perfect solution, 22 subsets with a 0.82% LOO error, 598 solutions with a 1.64% LOO error, and 1855 solutions with a 2.46% LOO error. The majority of solutions (21,895) contained a 6.65% LOO error. A more detailed distribution of error occurrence vs LOO error for both the RSS and hybrid methods can be seen in Figure 2. All solutions were stored in an MySQL database.
When comparing only the top 10 ranked features selected by the three methods, systolic blood pressure, Ethny_0, Ethny_1, CYP11B2_1 are shared among all. The hybrid also shared LDL cholesterol and Ethny_2 with RFE and brain natriuretic peptide with RSS. ACE_0 and ACE_1 were also shared between RFE and RSS. The predominant presence of ethnicity among solutions can easily be explained because hypertension is not a monogenetic disorder, but a polygenic trait (Dominiczak et al., 2004) meaning that a gene may be responsible for the disorder in one population, but not necessarily in another. “Diagnostic SVM” analysis “Diagnostic SVM” is an efficient tool to search for trends in data. After entering the genetic profile and clinical data in “Diagnostic SVM”, it predicts whether a subject is hypertensive and returns the dot product of áwt,xñ summed with the bias b. By varying entry values, it is easy to see whether the change favors normotensive classification or not, by the dot product result. When compensating for normotensive in the unbalanced dataset, better results seemed to be obtained when using flexible margins than when applying a cost factor where training errors on the positive samples outweigh errors on the negative samples. In general, the results show that AGT0, ECA0, AS1, MRA0, MRG0, MRG1, glucose, Ethny_0, and Ethny_1 favor normotensive classification while ECA1, MRA1, MRA2, LDL cholesterol, triglycerides, urea, and brain natriuretic peptide favor hypertensive classification. As expected, wild-type genes favor SVM classification for normotensive. Some unexpected results were also obtained such as high LDL cholesterol favoring normotensive in a profile having Ethny_1 and AGT0. Glucose favoring normotensive classification could be a consequence of the relatively young age in normotensive subjects (average = 48 years); the high glucose index could act as a diuretic, making the body eliminate fluids consequently lowering its pressure. In the long-run, glucose attacks the kidney and favors the development of hypertension. DISCUSSION AND CONCLUSIONS Hypertension is one of the most important risk factors for cardiovascular diseases. Although its pathogenesis is not well elucidated, it is known that high blood pressure is influenced by a complex interaction between environmental and genetic factors. In the current study, hypertension is used as a model for the methods employed which, in accordance with other works, yield strong evidence of a genetic association between the polymorphic RAAS genes and essential hypertension (Isa et al., 1990; Benetos et al., 1996). Our aim was not to demonstrate a new method for diagnosing hypertension, but to use it as a study model since it can be easily diagnosed. The same strategy presented here could be used for other hypertension cases such as predicting medication for a combined genetic/clinical profile, or even be applied to other pathologies. The feature ranking strategy was based on RFE and/or grouping results obtained from RSS and sorting them by LOO error followed by number of support vectors. The number of support vectors is related to the capability of generalization of a model: a model with less support vectors is expected to generalize best. It was also observed that, in general, the expected LOO error is proportional to the number of support vectors. We did not use a higher order k-fold cross-validation technique due to the limited and unbalanced dataset. For more complex models, other parameters could also be used to efficiently estimate the SVM generalization performance such as the geometrical margin between classes or even the xa-estimators (Joachims, 2000). When dealing with an extremely large number of features, after using RFE, the RSS could also be substituted by other methods. The complex combination of a genetic profile with environmental/clinical data in pathogenesis, follow-up or diagnosis is a challenge. Population heterogeneity and innumerous external factors greatly influence a classifier decision; knowing which ones to choose is a key for improved diagnosis. Poorly chosen features may add noise and degrade classifier performance. Increasing the number of features can quickly make exhaustive feature search impossible. Classical feature selection approaches can rapidly find a good solution, but it is not guaranteed to be the best, nor possess a good generalization performance for a desired genetic profile. Obtaining optimal pre-computed feature selected subsets to inquire for important clinical data, followed by SVM analysis, is a solution that can assist doctors in personalized medical diagnosis and that can also reveal trends in the dataset. The hybrid method outperformed RFE and RSS when used in their isolated forms, e.g., finding good solutions faster. The construction of such databases can be very time-consuming: the database for this work took up to 5 days. “Diagnostic SVM” justifies the importance of such databases because it can instantly retrieve a set of clinical features that, combined with the genetic profile, performs best, followed by SVM classification. What could take hours or days of computing is available on-the-fly making this strategy feasible to implement as a routine without the demand of great computing power. The functional value of the classification process (áw,xñ + b) can also be an indicator to measure the “degree of risk or disease stage” of hypertension, or of other pathologies in future studies. The optimal and near optimal solutions generated here are of great importance, especially when used for the design of systems based on heuristics and rules in a knowledge-specific domain that can advice or make recommendations, much like a human expert would. These approaches applied to expert systems, can result in a great performance, especially where a good deal of training and specialized knowledge is required to assist doctors in future personalized diagnosis. ACKNOWLEDGMENTS We thank Instituto Oswaldo Cruz (IOC), CNPq, FAPERJ, and Fiocruz PDTIS for financial support. REFERENCES Alvarez R, Gonzalez P, Batalla A, Reguero JR, et al. (2001). Association between the NOS3 (-786 T/C) and the ACE (I/D) DNA genotypes and early coronary artery disease. Nitric Oxide 5: 343-348. Baudin B (2000). Angiotensin I-converting enzyme gene polymorphism and drug response. Clin. Chem. Lab. Med. 38: 853-856. Baudin B (2002). Angiotensin II receptor polymorphisms in hypertension. Pharmacogenomic considerations. Pharmacogenomics 3: 65-73. Benetos A, Topouchian J, Ricard S, Gautier S, et al. (1995). Influence of angiotensin II type 1 receptor polymorphism on aortic stiffness in never-treated hypertensive patients. Hypertension 26: 44-47. Benetos A, Cambien F, Gautier S, Ricard S, et al. (1996). Influence of the angiotensin II type 1 receptor gene polymorphism on the effects of perindopril and nitrendipine on arterial stiffness in hypertensive individuals. Hypertension 28: 1081-1084. Bonnardeaux A, Davies E, Jeunemaitre X, Fery I, et al. (1994). Angiotensin II type 1 receptor gene polymorphisms in human essential hypertension. Hypertension 24: 63-69. Boser BE, Guyon IM and Vapnik VN (1992). A training algorithm for optimal margin classifiers. Proceedings of the 5th Annual Workshop on Computational Learning Theory. July 27-29. ACM Press, New York, 144-152. Cover TM and Van Campenhout JM (1977). On the possible orderings in the measurement selection problem. IEEE Trans. Syst. Man Cybern. 9: 657-661. Dominiczak AF, Brain N, Charchar F, McBride M, et al. (2004). Genetics of hypertension: lessons learnt from Mendelian and polygenic syndromes. Clin. Exp. Hypertens. 26: 611-620. Guyon I, Weston J, Barnhill S and Vapnik VN (2002). Gene selection for cancer classification using support vector machines. Mach. Learn. 46: 389-422. Inoue I, Nakajima T, Williams CS, Quackenbush J, et al. (1997). A nucleotide substitution in the promoter of human angiotensinogen is associated with essential hypertension and affects basal transcription in vitro. J. Clin. Invest. 99: 1786-1797. Isa MN, Boyd E, Morrison N, Harrap S, et al. (1990). Assignment of the human angiotensinogen gene to chromosome 1q42-q43 by nonisotopic in situ hybridization [corrected]. Genomics 8: 598-600. Ishigami T, Umemura S, Tamura K, Hibi K, et al. (1997). Essential hypertension and 5' upstream core promoter region of human angiotensinogen gene. Hypertension 30: 1325-1330. Jeunemaitre X, Soubrier F, Kotelevtsev YV, Lifton RP, et al. (1992). Molecular basis of human hypertension: role of angiotensinogen. Cell 71: 169-180. Jeunemaitre X, Inoue I, Williams C, Charru A, et al. (1997). Haplotypes of angiotensinogen in essential hypertension. Am. J. Hum. Genet. 60: 1448-1460. Joachims T (1998). Making large-scale support vector machine learning practical. In: Advances in Kernel methods - support vector learning (Schoelkopf B, Burges CJ and Smola AJ, eds.). MIT Press, Cambridge. Joachims T (2000). Estimating the generalization performance of a support vector machine efficiently. Proceedings of the International Conference on Machine Learning. June 29-July 2. Morgan Kaufmann, San Francisco, 431-438. Joachims T (2002). Learning to classify text using support vector machines: methods, theory and algorithms. Kluwer Academic Publishers, Norwell. Lindpaintner K, Pfeffer MA, Kreutz R, Stampfer MJ, et al. (1995). A prospective evaluation of an angiotensin-converting-enzyme gene polymorphism and the risk of ischemic heart disease. N. Engl. J. Med. 332: 706-711. Nalogowska-Glosnicka K, Lacka BI, Zychma MJ, Grzeszczak W, et al. (2000). Angiotensin II type 1 receptor gene A1166C polymorphism is associated with the increased risk of pregnancy-induced hypertension. Med. Sci. Monit. 6: 523-529. Poch E, Gonzalez D, Giner V, Bragulat E, et al. (2001). Molecular basis of salt sensitivity in human hypertension. Evaluation of renin-angiotensin-aldosterone system gene polymorphisms. Hypertension 38: 1204-1209. Pontremoli R, Ravera M, Viazzi F, Nicolella C, et al. (2000). Genetic polymorphism of the renin-angiotensin system and organ damage in essential hypertension. Kidney Int. 57: 561-569. Shah SC and Kusiak A (2004). Data mining and genetic algorithm based gene/SNP selection. Artif. Intell. Med. 31: 183-196. Stella P, Bigatti G, Tizzoni L, Barlassina C, et al. (2004). Association between aldosterone synthase (CYP11B2) polymorphism and left ventricular mass in human essential hypertension. J. Am. Coll. Cardiol. 43: 265-270. Vapnik VN (1995). The nature of statistical learning theory. Springer-Verlag, New York. |
|