![]()
![]()
![]()
![]()
![]()
![]()
![]()
![]()
![]()
![]()
![]()
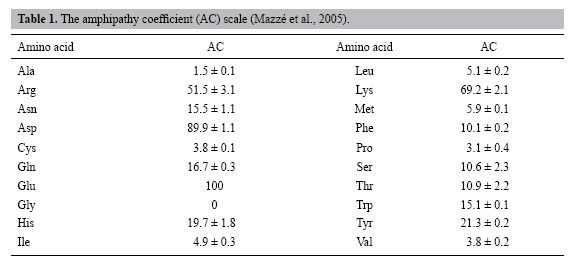
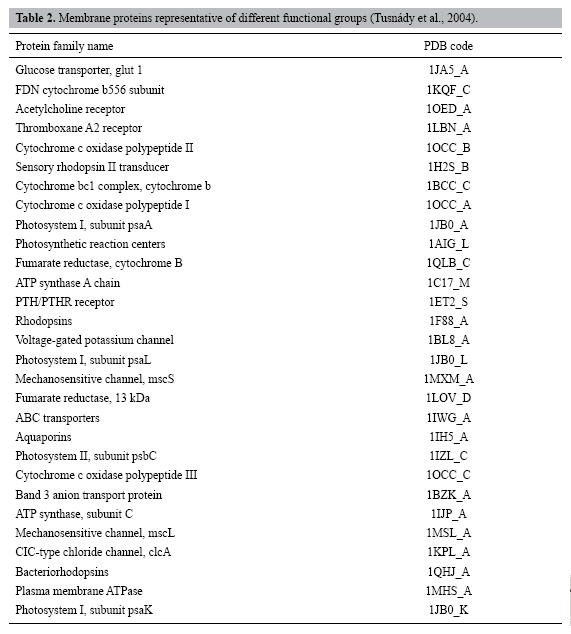
| Recognition of α-helix transmembrane domains with an amphipathy scale generated by molecular dynamics using only the primary sequence of proteins F.M. Mazzé, C.A. Fuzo, P. Ciancaglini and L. Degrève Grupo de Simulação Molecular, Departamento de Química, Faculdade de Filosofia, Ciências e Letras de Ribeirão Preto, Universidade de São Paulo, Ribeirão Preto, SP, Brasil Corresponding author: F.M. Mazzé E-mail: [email protected] Genet. Mol. Res. 6 (2): 422-433 (2007) Received February 08, 2007 Accepted May 25, 2007 Published June 30, 2007 ABSTRACT. We recently developed an amphipathy scale, elaborated from molecular dynamics data that can be used for the identification of hydrophobic or hydrophilic regions in proteins. This amphipathy scale reflects side chain/water molecule interaction energies. We have now used this amphipathy scale to find candidates for transmembrane segments, by examining a large sample of membrane proteins with α-helix segments. The candidates were selected based on an amphipathy coefficient value range and the minimum number of residues in a segment. We compared our results with the transmembrane segments previously identified in the PDB_TM database by the TMDET algorithm. We expected that the hydrophobic segments would be identified using only the primary structures of the proteins and the amphipathy scale. However, some of these hydrophobic segments may pertain to hydrophobic pockets not included in transmembrane regions. We found that our amphipathy scale could identify α-helix transmembrane regions with a probability of success of 76% when all segments were included and 90% when all membrane proteins were included. Key words: Membrane protein, Protein structure, Amphipathy scale, Primary structures, α-Helix transmembrane segments, Hydrophobic protein regions INTRODUCTION Membrane proteins account for about 25% of the total proteins in various organisms (Jones, 1998; Wallin and von Heijne, 1998; Krogh et al., 2001). They play important roles in physiological processes such as communication and transport between cells. They have also been involved in many recent pharmaceutical developments. Despite their importance, they are poorly represented in the Protein Data Bank (PDB) (http://rcsb.org/pdb) due to difficulties in crystallizing these proteins in an aqueous environment (Tusnády et al., 2004). To date, more than 35,000 three-dimensional (3-D) structures are deposited in the PDB, with few 3-D membrane protein structures: only 116 unique proteins and 225 coordinated files of transmembrane protein structures have been cataloged in PDB (http://blanco.biomol.uci.edu/Membrane_Proteins_xtal.html). Moreover, the experimental data generally do not inform the exact position of the protein transmembrane region in the lipid bilayers (Lee, 2003), with the exception of a few membrane proteins bound to lipid molecules (Tusnády et al., 2004, 2005). Inspection of the 3-D protein structure can give information on the transmembrane segments. This can be done roughly by means of visual inspection. Recently, Tusnády et al. (2004, 2005) developed an algorithm, TMDET, to find the most likely position of the protein in the membrane by using the protein coordinates to precisely define the segments embedded in membranes. These results were collected in a database, called the PDB_TM (Protein Data Bank of Transmembrane Proteins) database (http://pdbtm.enzim.hu). Once the primary sequence of an integral membrane protein is known, a common practice in laboratories is to utilize amino acid amphipathy scales to find primary information about the segments that can possibly be elected as trans- or loop membrane segments (Mazzé et al., 2005). The most important recent applications of amphipathy scales have been for predicting protein regions in hydrophilic or hydrophobic environments, solely based on amino acid sequences. Many amphipathy scales have been proposed based on various methodologies (Wilce et al., 1995; Mazzé et al., 2005). Amphipathy scales for amino acid side chains have been, for example, experimentally derived from solution/bulk partition coefficients, or from the transfer-free energies of individual amino acids, based on solubility differences in water versus a nonpolar solvent. Empirically derived amphipathy scales have been based on the fraction of the amino acid side chain surface accessible to the solvent or based on the fraction buried in the interior of the proteins, as found in X-ray structures of globular proteins. Some of the amphipathy scales have also been produced by modifying and/or combining earlier scales. The significant differences existing between the many amphipathy scales that have been proposed (Kyte and Doolittle, 1982; Sweet and Eisenberg, 1983; Rose et al., 1985a) have been discussed elsewhere (Rose et al., 1985b; Parker et al., 1986; Wilce et al., 1995; Mazzé et al., 2005). For example, residues that are strongly hydrophobic based on one scale may score as strongly hydrophilic in others (Kyte and Doolittle, 1982). It is thought that the current limitation of the predictive methods lies in the method by which the amphipathy parameters of individual amino acids were derived (Wilce et al., 1995). Recently, Mazzé et al. (2005) reported a new amphipathy coefficient scale (AC scale) elaborated from molecular dynamics data that can be used for the identification of the hydrophobic or hydrophilic regions in proteins. The molecular dynamics simulations (Degrève et al., 2004; Murakami et al., 2005) allow us to obtain information on the trajectories of the atoms during the simulation and the interaction energies occurring in the systems. The AC scale (Mazzé et al., 2005) was constructed by standardizing the amphipathy coefficient (AC) in the 0 to 100 range using the conversion AC = -0.872 * <E> where <E> is the mean interaction energy between the side chains of all the common amino acids and the water molecules (in kcal/mol). This method has the advantage of not taking into account arbitrary choices since it allows us to obtain the amino acid amphipathy directly from its fundamental meaning, which is a measure of the interaction of the amino acids with the surrounding medium. A first test of the applicability of the AC scale (Mazzé et al., 2005) was conducted by applying it to the primary sequence of a photosynthetic reaction center protein of Rhodopseudomonas viridis. It was possible to identify the transmembrane and/or hydrophobic regions of this membrane protein. However, this first test was realized under conditions that were appropriate for this R. viridis transmembrane protein: i) segments constituted of roughly 20 or more residues where AC < 22 are probably transmembrane regions; ii) segments constituted of less than 20 residues where AC < 22 are probably not transmembrane segments, but are segments located in other hydrophobic regions. The main question that remains is: what are the best general criteria that must be applied to a large variety of membrane proteins to obtain the best prediction for the identification of transmembrane regions? Determination of these conditions will be of the great relevance for the prediction of α-helix transmembrane domains based only on the primary sequence of membrane proteins. We applied the AC scale to all of the available primary structures of membrane proteins containing α-helix segments with the purpose of precisely defining the conditions that must be used to best identify the transmembrane segments, based only on primary sequences. A fair concordance between the predictions of the AC scale and the inspection of the known structures will be a good criterion to prove the ability of the AC scale to recognize α-helix transmembrane domains. METHODS The AC values (Table 1) were used to construct amphipathy plots (AC values against residue number). Table 2 lists the membrane proteins with known 3-D structures that we used in our study. The hydrophobic segments obtained by the amphipathy plots that were selected as possible transmembrane segment candidates were compared with the transmembrane segments available in the PDB_TM database (Tusnády et al., 2004, 2005).
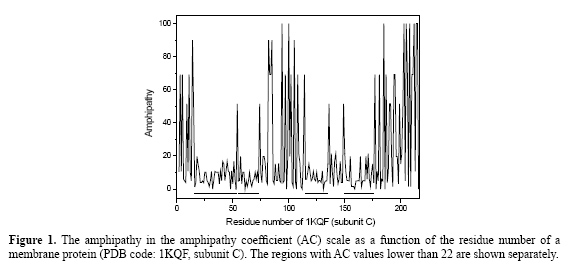
The following steps were followed for the selection of the candidates for transmembrane segments: determination of the AC value range to select the segments; determination of the minimum number of residues in a segment in order to consider it as a candidate to be a transmembrane segment; to check the method, determination of the number of consecutive residues that are coincident in the AC scale method and in the PDB_TM database, and, finally, application to membrane and globular proteins. RESULTS Determination of the amphipathy coefficient value range that best selects the segment candidates to be identified as transmembrane segments An example of the amphipathy plot given in Figure 1 shows that the AC values change quickly in the 0 to 100 range, but the AC values remain low (between 0 and 22) in some regions of the protein. As it we previously observed (Mazzé et al., 2005), it is probable that some of these sequences with AC values in the 0 to 22 range would be good candidates for transmembrane regions. The choice of sequences with AC values lower than 22, which are the values that will be used in the next analysis, is consistent with the fact that the transmembrane segments are generally sets of nonpolar uncharged residues that correspond to residues with low amphipathy. Based on these premises, at least four candidates (segments 16-53, 55-73, 115-135, and 150-176) for transmembrane segments were detected in Figure 1.
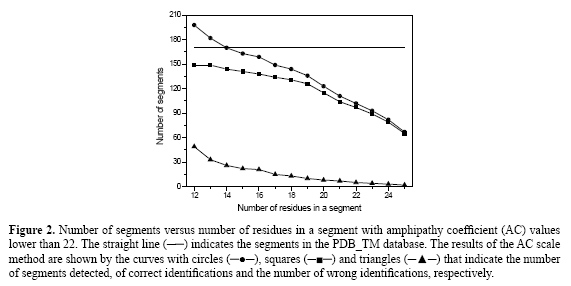
Determination of the minimum number of residues necessary for a segment to be considered as a candidate transmembrane segment It is accepted that the physical length of the transmembrane segments is frequently of the order of 3 nm so that the number of constituting residues cannot be too small. The distance between the Cα atoms of successive residues along the axis in α-helix is about 0.15 nm so that the number of residues in a transmembrane region must be around 20. The second step is to determine the number of residues, in the segments with AC values lower than 22 that will give the best results for identifying correctly the candidates for transmembrane segments, taking into account that this number must be around 20. For this purpose, tests were realized with a range going from 12 to 25 of consecutive residues with AC values lower than 22. The segments selected in this way were compared with the PDB_TM database results. The comparison is feasible if one more preliminary condition is imposed: the number of coincident amino acids in the data obtained by both methods. At this point, if at least 10 residues are identified by both methods as pertaining to a transmembrane segment, the AC scale identification is accepted. The value of 10 for the number of residues identified simultaneously by the AC scale and by PDB_TM database as being located in transmembrane segments is an arbitrarily defined value that will be, however, more precisely determined later. Figure 2 shows the comparison between the results obtained by the AC scale and the PDB_TM database as a function of the attempted lengths of the segments. In this figure, the straight line indicates the total number of transmembrane segments in the PDB_TM database (171 transmembrane segments). The circles indicate the number of segments with AC values lower than 22 detected versus the number of residues in a segment. The squares show how many of these segments are really transmembrane segments and the differences between these curves are shown with triangles: this is the number of segments wrongly detected as transmembrane segments.
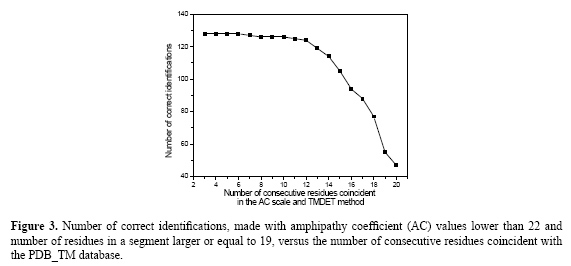
The profile of the curve with circles shows, in Figure 2, that a segment length of 12 favors the identification of too many short hydrophobic segments that generally are not transmembrane, as confirmed by the curve with triangles. However, the excess of wrong identifications decreases with an increase in the number of residues in a segment. As the number of residues in a segment increases, the probability of finding a long hydrophobic segment outside the membrane or outside the hydrophobic region is more and more reduced, so that the number of wrong identifications tends to zero. At the same time, the number of possible candidates for transmembrane segments identified by the AC scale (curve with circles) also decreases significantly, since the number of residues in most of the transmembrane segments is about 20 in proteins. Consequently, two behaviors can be observed in Figure 2: when the number of residues is smaller than 19, the number of wrong identifications is too high; if the number of residues is larger than 19, the number of candidates for transmembrane segments decreases quickly. In view of these arguments, an acceptable choice for the number of residues in a segment is 19. This is the value used in the next analysis. Determination of the minimum number of consecutive residues that must be coincident in the amphipathy coefficient scale and PDB_TM database For this purpose, sequences of at least 19 residues with AC values lower than 22 were compared with the PDB_TM database results and the number of coincidences was counted. The results are shown in Figure 3. In this figure, it can be seen that the number of correct identifications is independent of the number of consecutive residues when it is smaller than 12. For example, when the number of consecutive residues is equal to 3, the number of correct identifications is equal to 128, and when the number of consecutive residues is equal to 12, the number of correct identifications is equal to 124 of the 171 transmembrane segments in the PDB_TM database. However, the number of correct identifications decreases rapidly for more than 12 consecutive residues. Consequently, 12 is a good choice for the number of consecutive residues.
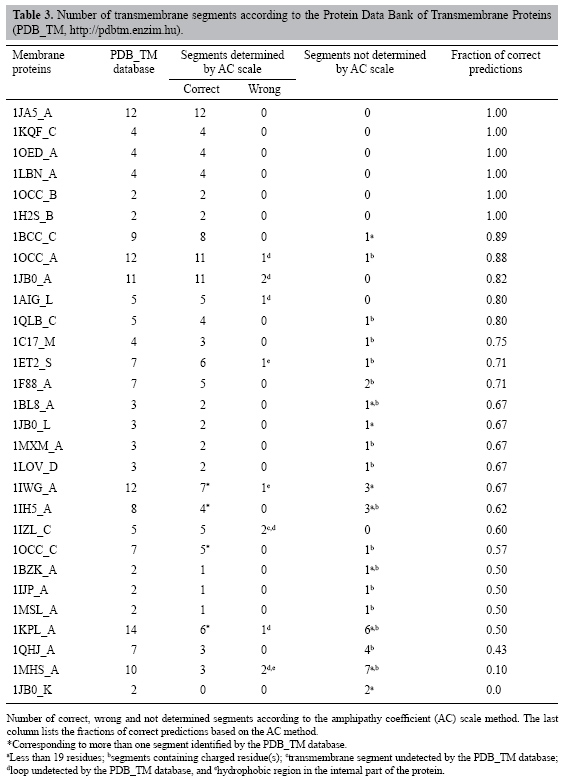
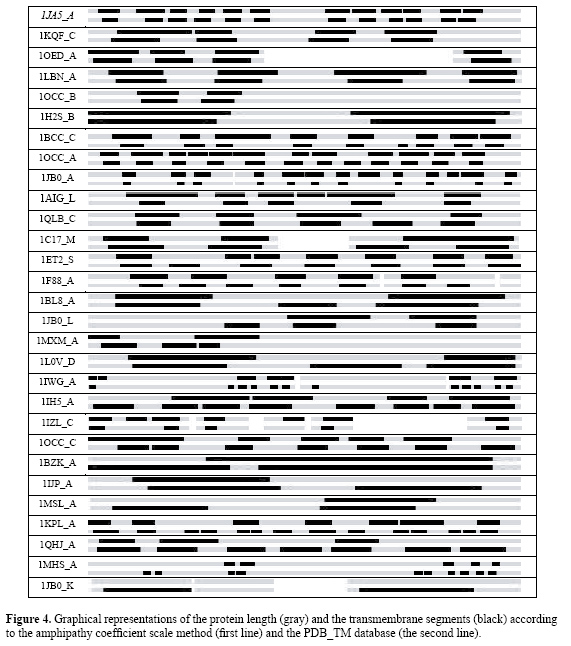
Recognition of α-helix transmembrane domains by the amphipathy coefficient scale In summary, the conditions of application of the AC scale are: consider the AC values lower than 22, the number of consecutive residues with AC values lower than 22 must be at least equal to 19 and the coincidence between the AC scale prediction and the PDB_TM database must be at least equal to 12 consecutive residues. After the determination of the ideal conditions to apply the AC scale to a primary sequence of proteins to identify the protein segments that have a great probability to be transmembrane segments, the AC scale can be extensively applied to proteins for this identification, the tests being done on membrane proteins, and on globular proteins to confirm. Membrane proteins The AC scale was applied to the 29 membrane proteins listed in Table 2. The results are shown in Table 3. Graphical representations of both identifications (PDB_TM database and AC scale) are plotted in Figure 4. The total number of transmembrane segments identified by the PDB_TM database is 171, while the number of correct identifications made by the AC scale is 131, resulting in a fraction of correct recognitions equal to 0.76. The correct segments marked with an asterisk correspond to an AC-identified segment that is identified as more than one segment by the PDB_TM database. In Table 3, a guide to estimate the quality of the results was introduced in the form of the fraction of the correct predictions made by the AC scale. Three different groups can be described in Table 3: a group where all the segments were correctly identified (6 proteins), a group where the fraction is larger than 0.50 (20 proteins) and another group presenting poor quality (fraction smaller than 0.50, 3 proteins). We observed that the method based on the AC scale was not efficient in only three cases (1QHJ_A, 1MHS_A and 1JB0_K). Two kinds of mistakes are listed in Table 3: absence of determination of the transmembrane segments and a wrong determination. Two explanations can be given to the non-identifications: the segment length is less than 19 (Table 3, letter "a") or the segments contain charged residues (Table 3, letter "b"). Two explanations can also be given to the wrong identifications: the first one is that the PDB_TM database does not consider loop segments as transmembrane segments (Table 3, letters "c" and "d") although a loop segment could be located inside the lipid bilayer; the second one is that some transmembrane regions can contain (in internal parts) hydrophobic segments that cannot be differentiated from transmembrane segments by the AC scale (Table 3, letter "e"), since the differentiation of the nature (inside or outside the membrane) of the hydrophobic regions is out of the scope of the method.
Globular proteins A further analysis must also be conducted to detect the limitations of the AC scale. This can be established by the application of the AC scale to proteins that certainly are not membrane proteins. A first test was done with well-characterized globular proteins like hexokinase (1BG3) and myoglobin (104M). In these cases, no candidate for transmembrane segment was found, showing that the AC scale can be applied without error to proteins without extensive hydrophobic regions. However, a wider-ranging test was done with the 85 globular proteins listed by Sandelin (2004). These proteins were submitted to the AC scale method, resulting in cases where zero (64 times), one (10 cases: 1AMX, 1BK7, 1CEM, 1CWY, 1DDE, 1DVN, 1GZI, 1JET, 1RIE, 1UCH), two (1AIR, 1AVP, 1CHD, 1QUV, 1TML, 1XNB), four (1TAH) and five (1THM) candidates for transmembrane segments were found. This can be understood since the globular proteins are also constituted by hydrophobic domains (present inside the hydrophilic region of the protein), and these hydrophobic domains can respond positively to the AC scale method, although with a small probability. CONCLUSIONS In order to check our approach based on the AC scale for the transmembrane segment identification, at least one representative example of each group of membrane proteins was chosen (see Table 2). The results allow us to conclude that the AC scale is appropriate for the recognition of the transmembrane segments of proteins since about 76% of the transmembrane segments were correctly identified (131 of 171 segments) and, if the number of proteins is taken into account, the percentage increases to 90% (26 of 29 proteins). These results were obtained only with one input: the amino acid sequence of the proteins. The carefully chosen conditions for the AC scale application are: the segment length must be formed by at least 19 consecutive residues with AC values lower than 22. These conditions are in agreement with the experimental data since a membrane thickness of 6-8 nm has a central core of 3-4 nm, corresponding to the high hydrophobic characteristic due to the fatty acyl chain (-CH2-) of lipids. This environment could correspond to a hydrophobic amino acid chain with 19 or a few more amino acids in α-helix structures resulting in a length of over 2.85 nm (0.15 nm per amino acid) (Gennis, 1989). The β-strand structures were not included because the sequences of hydrophobicity do not allow the use of our method, due to a lack of previous information on the protein structure. Some transmembrane segments were not found by the AC scale method due to the irregular curvature of the amino acid chains and/or due to the presence of one or more charged amino acids as can often be observed in ionic channels, protein transporters or exchanger proteins (see Table 2). An example is the Bacteriorhodopsin (1QHJ_A), constituted by three monomers containing charged amino acids in a contiguous α-helix (Belrhali et al., 1999). Since, up to now, crystallographic data are available only for Ca-ATPase, there are doubts about their numbers of transmembrane segments for the other membrane ATPases (Kuhlbrandt et al., 2002). Finally, in the case of Photosystem I (1JB0_L), there are doubts if this protein is a peripheral or an amphitropic protein (Jordan et al., 2001). This does not void the ability of the AC scale to recognize transmembrane segments since in these three cases the experimental data indicate that these proteins are not transmembrane proteins that are in contact only with the inner part of the membranes. Another important point on behalf of the AC scale is that it practically does not identify extra-transmembrane fragments (three segments in 171 segments, one of them being in the 1MHS_A peptide, which is one of the three peptides for which no transmembrane segments were found, see Table 3, letter "e"). Such cases can be correctly named as putative transmembrane fragments based on detailed study of protein function. Moreover, the method is also fairly correct when applied to proteins without extensive hydrophobic regions. On the whole, the use of the AC scale is very advantageous; it can be used to examine unknown proteins for which the secondary/tertiary structures remain unknown and also when the protein function or location have not been determined. We found that the AC scale can identify α-helix and loops in transmembrane regions with a probability of success of 76% for the segments and 90% for the proteins. ACKNOWLEDGMENTS The authors thank Mrs. Priscila Cerviglieri for revising the manuscript. We also thank FAPESP and CNPq for the continuous support given to our laboratories. F.M. Mazzé and C.A. Fuzo acknowledge grants from FAPESP. REFERENCES Belrhali H, Nollert P, Royant A, Menzel C, et al. (1999). Protein, lipid and water organization in bacteriorhodopsin crystals: a molecular view of the purple membrane at 1.9 Å resolution. Structure 7: 909-917. Degrève L, Brancaleoni GH, Fuzo CA, Lourenzoni MR, et al. (2004). On the role of water in the protein activity. Braz. J. Phys. 34: 102-115. Gennis RB (1989). Biomembranes: molecular structure and function. Springer-Verlag, New York. Jones DT (1998). Do transmembrane protein superfolds exist? FEBS Lett. 423: 281-285. Jordan P, Fromme P, Witt HT, Klukas O, et al. (2001). Three-dimensional structure of cyanobacterial photosystem I at 2.5 Å resolution. Nature 411: 909-917. Krogh A, Larsson B, von Heijne G and Sonnhammer EL (2001). Predicting transmembrane protein topology with a hidden Markov model: application to complete genomes. J. Mol. Biol. 305: 567-580. Kuhlbrandt W, Zeelen J and Dietrich J (2002). Structure, mechanism, and regulation of the Neurospora plasma membrane H+-ATPase. Science 297: 1692-1696. Kyte J and Doolittle RF (1982). A simple method for displaying the hydropathic character of a protein. J. Mol. Biol. 157: 105-132. Lee AG (2003). Lipid-protein interactions in biological membranes: a structural perspective. Biochim. Biophys. Acta 1612: 1-40. Mazzé FM, Fuzo CA and Degrève L (2005). A new amphipathy scale I. Determination of the scale from molecular dynamics data. Biochim. Biophys. Acta 1747: 35-46. Murakami MT, Arni RK, Vieira DS, Degreve L, et al. (2005). Correlation of temperature induced conformation change with optimum catalytic activity in the recombinant G/11 xylanase A from Bacillus subtilis strain 168 (1A1). FEBS Lett. 579: 6505-6510. Parker JM, Guo D and Hodges RS (1986). New hydrophilicity scale derived from high-performance liquid chromatography peptide retention data: correlation of predicted surface residues with antigenicity and X-ray-derived accessible sites. Biochemistry 25: 5425-5432. Rose GD, Geselowitz AR, Lesser GJ, Lee RH, et al. (1985a). Amphipathy of amino acid residues in globular proteins. Science 229: 834-838. Rose GD, Gierasch LM and Smith JA (1985b). Turns in peptides and proteins. Adv. Protein Chem. 37: 1-109. Sandelin E (2004). On hydrophobicity and conformational specificity in proteins. Biophys. J. 86: 23-30. Sweet RM and Eisenberg D (1983). Correlation of sequence hydrophobicities measures similarity in three-dimensional protein structure. J. Mol. Biol. 171: 479-488. Tusnády GE, Dosztányi Z and Simon I (2004). Transmembrane proteins in the Protein Data Bank: identification and classification. Bioinformatics 20: 2964-2972. Tusnády GE, Dosztányi Z and Simon I (2005). PDB_TM: selection and membrane localization of transmembrane proteins in the protein data bank. Nucleic Acids Res. 33: D275-D278. Wallin E and von Heijne G (1998). Genome-wide analysis of integral membrane proteins from eubacterial, archaean, and eukaryotic organisms. Protein Sci. 7: 1029-1038. Wilce MCJ, Aguilar MI and Hearn MTW (1995). Physicochemical basis of amino acid amphipathy scales: evaluation of four new scales of amino acid amphipathy coefficients derived from RP-HPLC of peptides. Anal. Chem. 68: 1210-1219. |
|